3.2
Impact Factor
ISSN: 1837-9664
J Cancer 2025; 16(1):122-134. doi:10.7150/jca.101046 This issue Cite
Research Paper
Pan-cancer analyses reveal cancer-type-specific autophagy signatures with potential implications for prognosis and therapy response
1. College of Bioinformatics Science and Technology, Harbin Medical University, Harbin 150081, China.
2. Medical imaging department, Shenzhen Second People's Hospital and the First Affiliated Hospital of Shenzhen University Health Science Center, Shenzhen 518035, China.
† These authors have contributed equally to this work and share first authorship.
Received 2024-7-16; Accepted 2024-10-29; Published 2025-1-1
Abstract

Autophagy is a common cellular degradation and recycling process that plays crucial roles in the development, progression, immune regulation, and prognosis of various cancers. However, a systematic assessment of the autophagy-related genes (ATGs) across cancer types is deficient. Here, a transcriptome-based pan-cancer analysis of autophagy with potential implications in prognosis and therapy response was performed. About 3 - 32 % of ATGs expressed differentially across 21 human cancers, and the autophagy-related score (ATS) based on differential ATGs could be used to predict the prognosis in 11 cancers, which was validated in multiple independent datasets. Autophagy was found to influence tumor immune microenvironment mainly by regulating tumor-infiltrating lymphocytes and myeloid-derived cells, and interactions between T cells and macrophages with lower ATS was enhanced to improve clinical outcomes by single cell analysis in bladder urothelial carcinoma (BLCA). In addition, the ATS was correlated with drug sensitivity and showed a capacity for prediction of therapy response in diverse cancers. Altogether, the results highlighted robust value of autophagy in cancer prognosis and treatment.
Keywords: Autophagy, Cancer, Prognosis, Tumor microenvironment, Therapy response
Introduction
Autophagy, defined as a highly conserved catabolic process, maintains cell metabolism, genomic integrity, and cell survival through the degradation of cytoplasmic organelles, proteins, and macromolecules, and the recycling of the breakdown products [1-3]. The dysfunction of autophagy has been associated with pathophysiological processes of cancer [4-6], which can either inhibit or promote tumor growth, depending on tumor type and stage, and the surrounding microenvironment [7, 8]. Some studies have reported autophagy-related gene signatures in hepatocellular carcinoma [9], and bladder cancer [10], cervical cancer [11], but few of them have linked these autophagy signatures to mechanisms underlying tumor microenvironment. Therefore, there is a need to identify autophagy-related gene signatures with comprehensive analyses on their downstream effects in pan-cancer.
It has shown that autophagy-related genes (ATGs) are involved in the modulation of immune response [12]. Noman et al. reported that hypoxia impaired elimination of non-small cell lung carcinoma cells by autologous cytotoxic lymphocytes [13]. Deficiencies in certain autophagy regulators, such as ATG7, can lead to T cell dysfunction [14]. The advent of single-cell RNA sequencing (scRNA-seq) technology provides a powerful tool to comprehensively explore the influence on the tumor microenvironment by autophagy. Tong et al. found that the effector function of T cells could be influenced and shaped by autophagy-associated pathways through the investigation of single-cell RNA sequencing in gastric cancer [15]. In addition, Autophagy also plays an important role in cancer resistance [16]. Autophagy modulation affects tumor resistance through some mechanisms that involve the PD1/PD-L1 axis [17] and CTLA4 signaling [18]. Ahamed Saleem et al. reported that one type of autophagy inhibitors termed hydroxychloroquine was clinically beneficial for prostate cancer patients [19]. Hence, connecting autophagy-related signatures to the TME and drugs will better understand the role of autophagy in the TME to overcome cancer therapy resistance.
In this study, we first performed an integrative analysis to explore the expression of 234 ATGs curated from human autophagy database (HADb) across 21 types of cancer. The RNA sequencing (RNA-seq) data from the gene expression omnibus database (GEO) database and the cancer genome atlas (TCGA) database were used for analysis and validation. We then used differential ATGs to establish autophagy-related score (ATS), and evaluated whether this signature was associated with survival outcomes and clinicopathological factors in 11 cancers. The association between ATS and tumor microenvironment was further investigated using bulk and single-cell RNA sequencing datasets. And finally, we evaluated the effects of ATS in identifying tumor immunotherapy and chemotherapy responders. Findings of this study may be valuable for predicting patients' prognosis and improving clinical therapeutic benefits.
Materials and Methods
Data collection and processing
HADb (http://www.autophagy.lu) is the first human autophagy-dedicated Database. Totals of 234 ATGs were downloaded from HADb as candidate genes. The expression data (RNA-sequencing read counts) and matched clinical data were downloaded from TCGA (https://portal.gdc.cancer.gov). We retained cancer types in which the number of cancer samples and normal samples is greater than 3. A total of 21 cancer types (bladder urothelial carcinoma (BLCA), breast invasive carcinoma (BRCA), cervical squamous cell carcinoma and endocervical adenocarcinoma (CESC), cholangiocarcinoma (CHOL), colon adenocarcinoma (COAD), Esophageal Carcinoma (ESCA), glioblastoma multiforme (GBM), head and neck squamous cell carcinoma (HNSC), kidney chromophobe (KICH),kidney renal cell carcinoma (KIRC), kidney renal papillary cell carcinoma (KIRP), liver hepatocellular carcinoma (LIHC), lung adenocarcinoma (LUAD), lung squamous cell carcinoma (LUSC), pancreatic adenocarcinoma (PAAD), pheochromocytoma and paraganglioma (PCPG), prostate adenocarcinoma (PRAD), rectum adenocarcinoma (READ), stomach adenocarcinoma (STAD), thyroid carcinoma (THCA), and uterine corpus endometrial carcinoma (UCEC)) were included in the analysis.
GSE2748, GSE13507, GSE68465, GSE72970, Breast Cancer (METABRIC, Nature 2012 & Nat Commun 2016), and ICGC-LIRI-JP were retrieved from Gene Expression Omnibus (GEO, https://www.ncbi.nlm.nih.gov/geo), cBio Cancer Genomics Portal (cBioPortal, http://www.cbioportal.org) and International Cancer Genome Consortium (ICGC, https://dcc.icgc.org), respectively. These datasets as independent external validation data, which comprised the gene expression and clinical data.
The scRNA-seq cohort of BLCA (GSE190888 and GSE186520) and KIRC (GSE121638) were downloaded from GEO. GSE103668 and GSE67501 contained cisplatin and bevacizumab treatment data for BRCA and nivolumab therapy information for KIRC, respectively. Cell line expression data and drug sensitivity data were downloaded from Genomics of Drug Sensitivity in Cancer (GDSC, https://www.cancerrxgene.org).
The gene sets for immune checkpoints [20, 21] and drug resistance [22] were collected in previous studies.
Differential and chromosomal localization analysis of ATGs
Differentially expressed ATGs (|log2FoldChange| >1, false discovery rate (FDR) < 0.05) were identified by the "DESeq2" package (1.42.1) [23]. The "RCircos" package (1.2.2) [24] was used for chromosomal localization.
Functional and pathway enrichment analyses
The "clusterProfiler" package (4.10.1) was applied for gene annotation enrichment analysis [25, 26]. Differential ATGs were submitted for Gene Ontology (GO) [27] and Kyoto Encyclopedia of Genes and Genomes (KEGG) [28] terms. The up- and down-regulated pathways in both ATS groups by performing gene set enrichment analysis (GSEA) [29].
Construction and validation of ATS
The following procedure applies to all cancer types. The differential ATGs were subjected to univariate and multivariate Cox regression analysis by the "survival" package (3.5-8) [30] in each cancer type, and those with p<0.05 were retained as prognostic markers and their corresponding weights were obtained to construct ATS. The formula was as follows:
where  is the baseline risk function,
  is the coefficient and
  is the expression level of the ATG. The ATS was calculated for each patient according to this formula, and they were divided into high- or low-ATS groups according to the median ATS. Kaplan-Meier survival curve was performed to observe the difference of overall survival (OS) between the two groups. By comparing the clinical traits, multivariate Cox regression analysis was used to confirm the independence of the prognostic model. Finally, multiple independent external sets were used to validate.
Assessment of correlation between ATGs and autophagy activation
The autophagy activation score was calculated using single-sample gene set enrichment analysis (ssGSEA) [31] based on a predefined gene list associated with autophagy activation [32]. Subsequently, the pearson correlation between the expression of ATGs and the autophagy activation score was determined.
Immune infiltration analysis
Multiple algorithms of immune infiltration analyses such as CIBERSORT [33], ssGSEA [31], MCPcounter [34], TIMER2 [35], xCell [36], and ESTIMATE [37] were used to explore the tumor microenvironment. The pearson correlation was valued between ATS and the immune score evaluated by ESTIMATE. And the Wilcoxon rank sum test was used to compare the infiltration level of immune cell types calculated by CIBERSORT, ssGSEA, MCPcounter, xCell, and TIMER2 between the high- and low-ATS groups.
Analysis of tumor microenvironment based on scRNA-seq data
The "Seurat" package (4.4.0) [38] was used for downstream analysis. Filtering low-quality cells was performed based on previous studies [39, 40]. Data preprocessing were used the SCTransform function [41] with default settings. Uniform manifold approximation and projection (UMAP) dimensionality reduction and cell clustering were performed utilizing the top 10 calculated dimensions and a resolution of 0.5. And cell-type identification utilized the known marker genes from previous studies [39, 42]. Next, autophagy-related cell clusters were identified using the Scissor approach [43]. In TCGA-BLCA data, the average expression of these cell-specific markers in this cell type was used to define the score for the cell type. Cell-cell interaction was identified within high- and low-ATS samples via the "CellChat" package (1.6.1) [44].
Association of ATS with tumor therapy response
The pearson correlation between ATS and immune checkpoint genes and drug resistance genes was calculated. Tumor immune dysfunction and exclusion (TIDE) [45] score was calculated online (http://tide.dfci.harvard.edu), and the Wilcoxon rank sum test was used to compare the TIDE scores between the high- and low-ATS groups. Based on the drug response of immunotherapy and chemotherapy data of GSE103668-BRCA and GSE67501-KIRC, respectively, receiver operating characteristic (ROC) curve and area under ROC (AUC) were performed through the "pROC" package (1.18.5) [46]. Meanwhile the pearson correlation between ATS and the half-maximal inhibitory concentration (IC50) as well as the AUC value for each drug across different cancers in GDSC was calculated to select potential autophagy-related therapeutic agents (|r|>0.5, p value<0.05).
Statistical analysis
Differences between two groups were determined by the Wilcoxon test measured. The log-rank test was applied to compare the survival statistics of categorical variables. All statistical tests were two-sided. P<0.05 was considered statistically significant. All data calculations, statistical analysis, and visualization were conducted in R 4.0.2 software.
Results
Pan-cancer landscape of autophagy
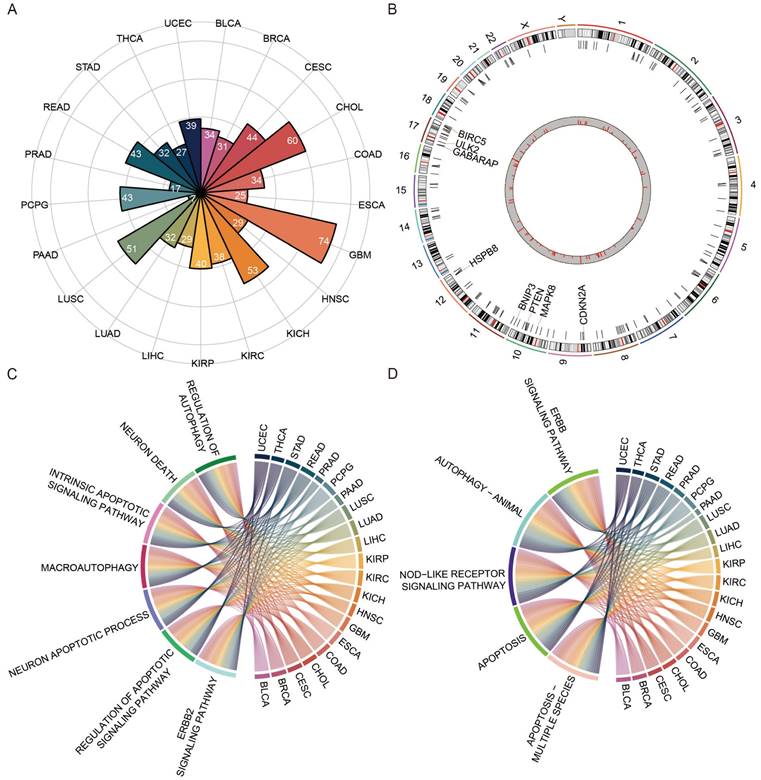
A total of 234 ATGs from HADb and a pan-cancer cohort of 8620 cases across 21 cancer types from TCGA were collected. The expression levels of ATGs were compared between cancer and matched normal samples. Approximately 3-32% of differentially expressed ATGs across 21 cancers, with the highest numbers in GBM and the lowest in PAAD (Figure 1A). The differential ATGs were distributed across 23 chromosomes, and enriched on chromosomes 10 and 17 (Figure 1B). GO and KEGG pathway enrichment analysis revealed those differential ATGs were mainly enriched in autophagy- and apoptosis-associated pathways (Figure 1C-D). Those showed that the autophagy processes in cancers were highly abnormal [47, 48].
The ATS associated with patients' survival in 11 cancers
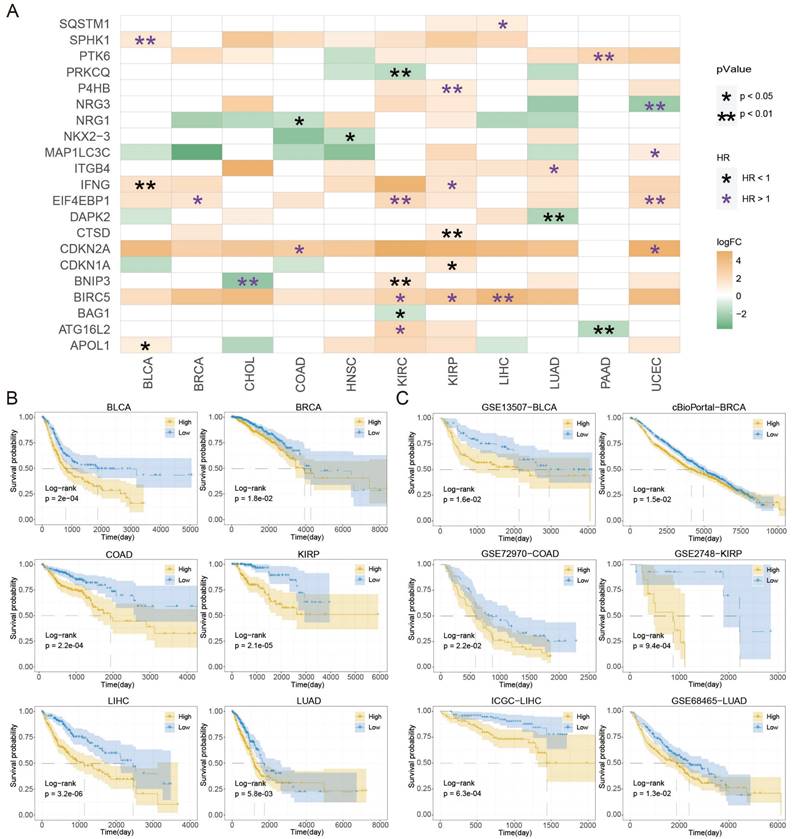
A total of 55 prognosis-related ATGs of 11 cancer types were identified through univariate Cox regression analysis respectively (Table S1). Subsequently, a multivariate Cox regression model was used to select feature ATGs for each cancer, and 21 ATGs were left for 11 cancer types (Table S2). The ATS was calculated for each cancer using its specific set of ATGs. Among those genes, BIRC5 and EIF4EBP1 exhibited higher expression and were associated with poor clinical outcomes in KIRC, KIRP, and LIHC; IFNG had elevated expression and different clinical outcomes in BLCA and KIRP; ATG16L2 and BNIP3 showed various expression and were associated with clinical outcomes in multiple cancer types (Figure 2A). In addition, the relationship between the extent of autophagy activation and the expression of ATGs identified through Cox regression analysis was examined (Figure S1). In BLCA, SPHK1 showed a significant correlation (cor=0.325, P=1.293e-11); BIRC5 was correlated in both LIHC (cor=-0.482, P=5.219e-23) and KIRP (cor=-0.44, P=4.608e-15); BAG1 was significantly correlated in KIRC (cor=0.376, P=1.807e-19). These findings suggest a connection between ATGs and tumor autophagy. These results demonstrated that autophagy might assist in predicting prognosis.
The landscape of differential autophagy genes in pan-cancer. (A) The number of differential ATGs in each cancer type. (B) Chromosome location and frequency of differential ATGs in cancer type. (C) The functional enrichment analyses of GO terms of ATGs in 21 cancer types. (D) KEGG pathway enrichment analysis of ATGs in 21 cancer types.
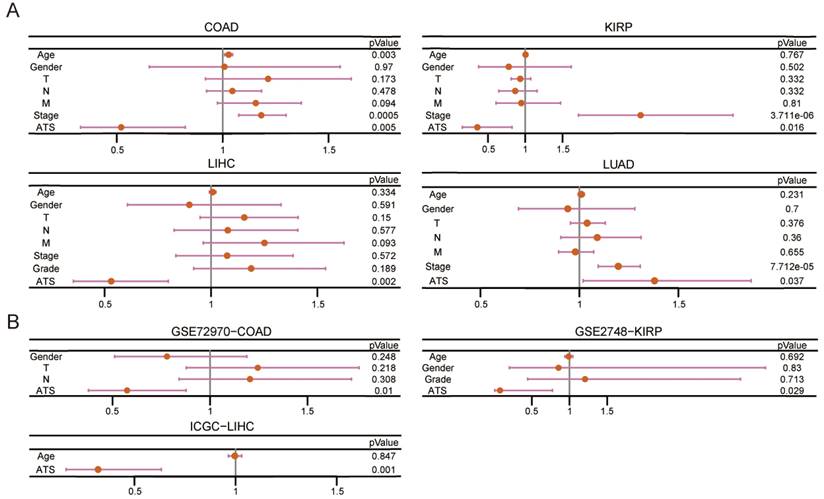
Kaplan-Meier plot revealed that patients in the high-ATS group had a poorer prognosis than those in the low-ATS group in 11 cancers (Figure 2B and Figure S2A). To validate the predictive value of the ATS for OS, six validation Cohorts from GEO, ICGC, and cBioPortal were analyzed. The high ATS was still correlated with poor OS (Figure 2C). ATS was an independent prognostic factor for patients of CHOL (HR=5.537, 95% CI= 1.639~18.706; P=0.006), COAD (HR=1.922, 95% CI=1.215~3.04; P=0.005), KIRC (HR=1.997, 95% CI=1.401~2.846; P=1.291e-04), KIRP (HR=2.796, 95% CI=1.216~6.428; P=0.016), LIHC (HR=1.883, 95% CI=1.251~2.833; P=0.002), LUAD (HR=1.38, 95% CI=1.019~1.869; P=0.037), PAAD (HR=2.004, 95% CI=1.287~3.119; P=0.002) and UCEC (HR=2.448, 95% CI=1.462~4.101; P=6.689e-04) through multivariate Cox regression analysis (Figure 3A and Figure S2B). In validation cohorts (GSE72970-COAD, GSE2748-KIRP, and ICGC-LIHC), the results were consistent with the TCGA training sets (Figure 3B). These results indicated that the ATS could be a robust indicator for prognosis in various cancers.
Prognostic roles of autophagy in pan-cancer. (A) The differential ATGs with clinical relevance in each cancer type. (B) Kaplan-Meier curves of OS of low and high groups stratified by the ATS in six cancer types (BLCA, BRCA, COAD, KIRP, LIHC, and LUAD) in training data. (C) Likewise, GSE13507-BLCA, cBioPortal-BRCA, GSE72970-COAD, GSE2748-KIRP, ICGC-LIHC, and GSE68465-LUAD patients in validation data.
The ATS is an independent prognostic factor. (A) Multivariate Cox regression of prognosis factor for OS of LIHC, COAD, KIRP, and LUAD patients in training data. (B) Likewise, GSE72970-COAD, GSE2748-KIRP, and ICGC-LIHC patients in validation data.
The ATS correlated with tumor immunity
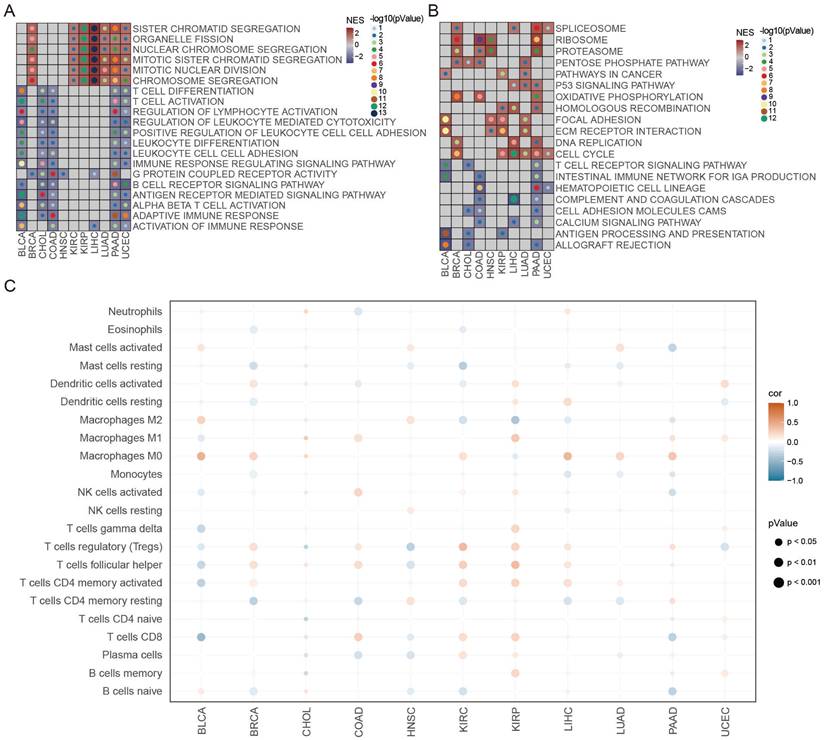
The biological features of differential genes between the high- and low-ATS groups were clarified using GSEA. As revealed by Figure 4A-B, the high-ATS groups were mainly involved in cell division and energy metabolism processes such as chromosome segregation, organelle fission, and oxidative phosphorylation, indicating that autophagy was related to cell cycle progression; the low-ATS groups concentrated on T cell activation and differentiation, regulation of lymphocyte activation, antigen processing and presentation, and B cell receptor signaling pathway and other immune-related processes, suggesting that autophagy was associated with the tumor immune microenvironment. Moreover, the correlation between ATS and the abundance of immune cell infiltration evaluated by the CIBERSORT algorithm was examined. The ATS was significantly negatively correlated with infiltration abundance of CD8 T cells and M1 macrophages in BLCA, but positively correlated in COAD and KIRP (Figure 4C). This implies that autophagy might contribute to inhibiting or stimulating immune responses. In addition, the ATS was also correlated with infiltration abundance of activated dendritic cells, Tregs, and activated NK cells (Figure 4C). We also observed that the ATS was significantly negatively correlated with immune scores calculated by the ESTIMATE algorithm in BLCA, but positively correlated in KIRC (Figure S3A-B). The infiltration abundance of CD8 T cells evaluated by the ssGSEA, MCPcounter, and xCell algorithm was higher in the low-ATS group in BLCA (Figure S3C), while lower in KIRC (Figure S3D). These results were consistent with those calculated using CIBERSORT.
Association between autophagy and tumor microenvironment in BLCA and KIRC based on scRNA-seq data
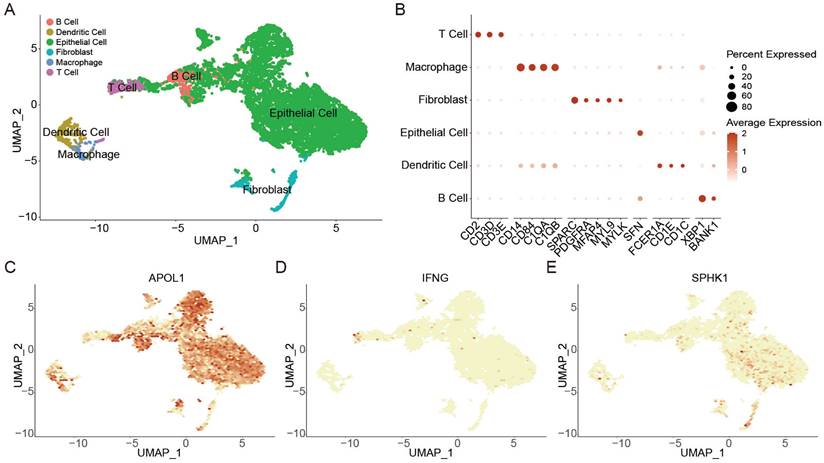
A total of 17,384 cells in 4 BLCA patients from two scRNA-seq datasets (GSE190888 and GSE186520) were used to dissect the mechanisms of autophagy associated with immune microenvironment. Using canonical cell-type markers (Figure 5B), these cells were identified into 6 cell types (Figure 5A). Non-immune cells primarily consisted of epithelial cells and fibroblasts. The identified immune cells included B cells, dendritic cells, macrophages, and T cells (Figure 5A). Next, the expression of ATS genes (APOL1, IFNG, and SPHK1) in BLCA were observed. High expression of APOL1 in the tumor microenvironment indicated that it played an important role in tumor invasion and immune defense [49] (Figure 5C); T cells displayed a high expression level of IFNG, mediating T cell killing to suppress tumors in immune regulation [50] (Figure 5D); SPHK1 was highly expressed in epithelial cells and fibroblasts, which might regulate fibroblast differentiation to promote cancer proliferation [51-54] (Figure 5E).
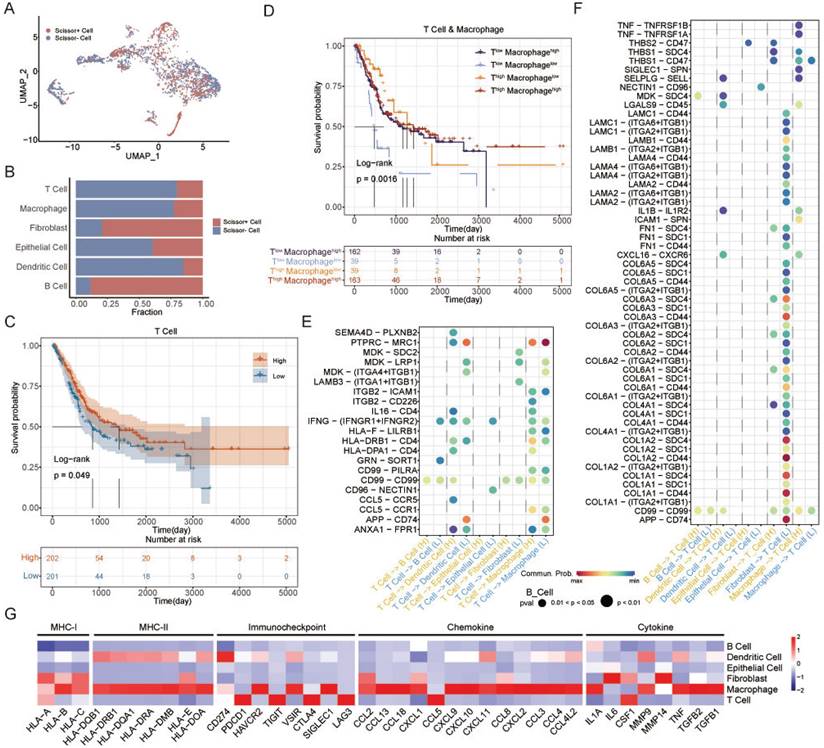
The Scissor algorithm can identify cell subgroups that are most relevant to a given phenotype by quantifying the similarity between each single cell and each bulk sample in the scRNA-seq data [43]. ATS-related cells were identified and classified into Scissor+ and Scissor- cell subgroups using the Scissor algorithm (Figure 6A). The Scissor- group was negatively associated with the ATS, and accounted for the majority of T cells, macrophages, and dendritic cells, and a small proportion of fibroblasts and B cells (Figure 6B). The T-cell and macrophage expression scores of TCGA-BLCA samples were calculated based on the T-cell and macrophage markers, respectively (Figure S4A-B). The samples were stratified into high or low expression groups according to the median value. Kaplan-Meier analysis revealed that the T-cellhigh group was correlated with better clinical prognosis (P=0.049; Figure 6C), while macrophage was not associated with patient survival (P=0.46; Figure S4C). However, patients with Macrophagehigh had the better OS than Macrophagelow in T-celllow group (P=0.0016; Figure 6D). This suggested that interactions between T cells and macrophages could regulate immune killing mechanisms and improve patient outcomes. Next, to investigate the interaction network of T cells in high- and low-ATS groups, potential ligand-receptor pairs were calculated using CellChat.
The functional enrichment and tumor immune microenvironment analyses of ATS. (A-B) GSEA analysis of differentially expressed genes between the high- and low-autophagy groups in each cancer. (A) GO. (B) KEGG. (C) Correlation between ATS and immune cells estimated by the CIBERSORT algorithm in each cancer.
Notably, in MK signaling pathway, ligand MDK and its multiple receptors, such as SDC2, LRP1, and ITGA4/ITGB1, were only active in the low-ATS group from T cells to dendritic cells, fibroblasts, and macrophages; in IFN-II signaling pathway, IFNG with multi-subunit receptor IFNGR1/IFNGR2 was active in the low-ATS group from T cells to B cells and epithelial cells and was more active in the low-ATS group from T cells to dendritic cells and macrophages than in the high-ATS group (Figure 6E). Multiple ligand-receptor pairs from ECM-receptor interaction pathways were found to be highly active in the low-ATS group from fibroblasts to T cells; ligand TNF with receptors TNFRSF1A and TNFRSF1B was active in the high-ATS group from macrophages to T cells (Figure 6F). Those interactions between T cells and other cells in low- and high-ATS groups might activate and regulate T cell function to exert effects on the tumor microenvironment, which led to survival differences. These findings suggest that interactions between T cells and macrophages contribute to improve patient survival. Additionally, the biological functions of the selected genes were described (Figure 6G). For example, both macrophages and T cells exhibited high expression levels of inflammatory/immune-related genes. It was also observed that these cells expressed elevated levels of immune checkpoint molecules, for example, macrophages had high levels of HAVCR2, VSIR, and SIGLEC1, and T cells showed high levels of PDCD1, TIGIT, CTLA4, and LAG3.
Besides, we explored the relationship between autophagy and the tumor microenvironment in KIRC. Totals of 12,239 cells in three KIRC patients in the GSE121638 dataset were clustered into six cell types, including B cells, DCs, macrophages, monocytes, NK cells, and T cells (Figure S5A). We observed that ATG16L2 was highly expressed in NK cells and T cells, potentially regulating their activation [55] (Figure S5B). Additionally, the high expression of BIRC5 in macrophages suggests its important role in tumor immune modulation [56] (Figure S5C). Using CellChat, we constructed an interaction network, and found that IFNG, interacting with its multi-subunit receptors IFNGR1/IFNGR2, was more active in the high-ATS group from T cells to DCs, macrophages, and monocytes compared to the low-ATS group; multiple ligand-receptor pairs involved in ECM-receptor interaction pathways were highly active in the high-ATS group from monocytes to T cells (Figure S5D-E). Meanwhile, macrophages, monocytes, NK cells, and T cells exhibited high expression levels of inflammatory/immune-related genes, indicating their potent antitumor effects (Figure S5F). These results demonstrate that autophagy influences tumor immunity through diverse mechanisms.
The effect of autophagy on the tumor microenvironment at the single-cell level in BLCA. (A) UMAP plot showing the annotation and color codes for cell types in the BLCA ecosystem. (B) Bubble plot showing the expression levels of marker genes in each cell type. (C-E) UMAP visualized plot showing the expression of genes for ATS of BLCA. (C) APOL1. (D) IFNG. (E) SPHK1.
Identification of autophagy-related T cells and differences of T-cell interactions associated with different ATS in BLCA. (A) The UMAP visualization of the Scissor-method selected cells. The red and blue dots are cells associated with the autophagy phenotype. (B) Bar plot showing cell proportion in each cell type by Scissor results. (C) Survival analysis of OS between the high and low T cell expression in TCGA-BLCA. (D) Survival analysis of OS between the Thigh Macrophagehigh, Thigh Macrophagelow, Tlow Macrophagehigh, and Tlow Macrophagelow in TCGA-BLCA. (E-F) Comparison of the ligand-receptor pairs in the cell-cell communication between the high- and low-ATS groups. Bubble chart showing the interaction between (E) T cells and other cells, (F) other cells and T cells, based on selected ligand and receptor pairs. (G) Heatmap displaying the expression levels of selected immunity/inflammatory genes across six cell types.
The ATS associated with cancer treatment
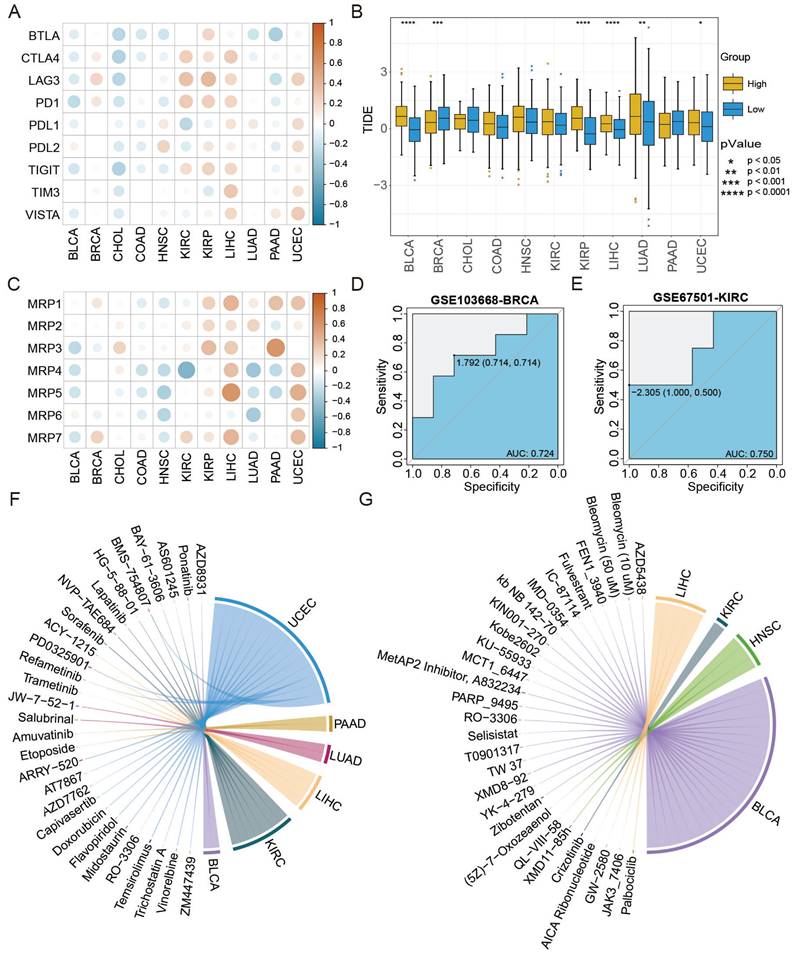
The ATS was associated with therapy response based on analyses of immune checkpoints, TIDE scores, and drug resistance genes. First, the ATS was negatively correlated with expression levels of most immune checkpoint genes in BLCA and CHOL, but positively correlated in BRCA, LIHC, and UCEC (Figure 7A). Next, the distribution of TIDE scores was compared between the high- and low-ATS groups. As shown in Figure 7B, TIDE scores were lower in the low-ATS group in BLCA (P=6.7e-15), KIRP (P=4.7e-09), and LIHC (P=5.1e-05), while higher in BRCA (P=7.3e-04). Last, the ATS was found to be negatively correlated with expression levels of drug resistance genes in BLCA and HNSC, while positively correlated in KIRP, LIHC, and UCEC (Figure 7C).
Furthermore, the AUC value was used to evaluate the accuracy of ATS in predicting treatment response. The therapy response achieved AUC of 0.724 and 0.75 for GSE103668-BRCA and GSE67501-KIRC, respectively (Figure 7D-E), suggesting the potential of the ATS as an indicator of therapy response. Besides, the correlation between the ATS and both IC50 and AUC values was calculated. The analysis revealed that the ATS was positively correlated with the IC50 (cor=0.527, P=2.056e-02) and AUC (cor=0.59, P=7.832e-03) of ponatinib in BLCA, but negatively correlated with IC50 (cor=-0.647, P=4.991e-03) and AUC (cor=-0.647, P=5.034e-03) of GW2580 in LIHC as well as with the IC50 (cor=-0.664, P=3.649e-03) and AUC (cor=-0.536, P=2.641e-02) of fulvestrant in BLCA (Figure 7F-G, Figure S6, Table S3, Table S4). Taken together, ATS might serve as an indicator for the response to different anti-cancer treatments.
ATS shows stronger predictive ability for immunotherapy and chemotherapy response. (A) Pearson correlation between ATS and expression levels of immune checkpoint genes. (B) Differences in TIDE scores between the high- and low-ATS groups. (C) Pearson correlation between ATS and expression levels of drug resistance genes. (D-E) Receiver operating characteristic curves of ATS to predict chemotherapy and immunotherapy response in (D) GSE103668-BRCA with chemotherapy cohort and (E) GSE67501-KIRC with immunotherapy cohort. (F-G) Pearson correlation between ATS and the IC50 value. (F) Positive correlation. (G) Negative correlation.
Discussion
Differentially expressed ATGs on the chromosomes were mainly enriched on chromosomes 10 and 17, such as BIRC5, BNIP3 and SQSTM1. Accumulating evidence has suggested those chromosomes harbor some key genes that influence cancer development and tumor prognosis. For instance, high BIRC5 expression may promote the proliferation of LIHC and reduce their susceptibility to chemoradiotherapy, leading to poor prognosis [57]. BNIP3 induces autophagy to degrade protein aggregates and dysfunctional organelles that can be harmful to the cell [58]. At the same time, arsenic trioxide induces autophagic cell death in malignant glioma cells by upregulation of BNIP3 [59]; loss of BNIP3 expression results in a more aggressive tumor phenotype correlating with worsened prognosis in patients with pancreatic cancer and increases resistance to 5-fluoro-uracil and gemcitabine [60]. SQSTM1 regulates metabolism through autophagy to provide nutrients that favor the survival and proliferation of tumor cells. SQSTM1 also impairs the presentation by antigen-presenting cells through autophagy failing to generate an effective anti-tumor cytotoxic T-cell response, which allows tumor cells to escape immune surveillance, which can promote LIHC progression and produce a poor survival rate [61, 62].
Enrichment analysis showed that the high-ATS group was mainly related to signaling pathways that control cell proliferation, and the low-ATS group was primarily concerned with the immune-inflammatory signaling pathways. Further exploration of the relationship between autophagy and tumor immunity found that autophagy could inhibit cancer progression by regulating the immune microenvironment or promote cancer proliferation in the exact opposite way [1, 3, 7, 63]. High CD8T cell and M1 macrophage infiltration were observed in the BLCA low-ATS group, which may be the reason why low-ATS patients have a better prognosis than high-ATS patients in BLCA. Interestingly, in the KIRP high-ATS group, patients had high CD8T cell infiltration but poor prognosis. It might be that exhausted CD8 T cells positively correlated with ATS (R=0.23, P=7.8e-05), resulting in the inability of CD8 T cells to exert their antitumor effects.
Next, BLCA was taken as an example to describe in detail the impact of autophagy-regulated tumor microenvironment on patient prognosis based on scRNA-seq data. It was found that IFNG-(IFNGR1+IFNGR2) was more active in the low-ATS group from T cells to B cells, DCs, and macrophages, which could regulate macrophages and DCs antigen presentation, B-cell proliferation and differentiation, and T-cell recruitment [64, 65]. Meanwhile, TNF-TNFRSF1A, TNF-TNFRSF1B, and IL1B-IL1R2 were found to activate in the high-ATS group from macrophages to T cells, which exerted anti-inflammatory effects to suppress immunity [66-68]. That was why interactions between T cells and macrophages in the low-ATS group could result in a good prognosis. Those showed that autophagy induced different immune cell interactions and affected the prognosis of patients, providing novel insights into the tumor microenvironment.
Last, the relationship between ATS and therapy response was analyzed to explore the practical value of ATS. Most of the cancer patients in the low-ATS group had a lower level of TIDE score, which indicated that they were more inclined to immunotherapy. Besides, a variety of drugs were related to ATS in different cancers, providing a novel guide to drug repositioning (Figure 7F-G). For example, chloroquine or hydroxychloroquine enhances the cytotoxicity of a few drugs, such as ponatinib [69, 70], by inhibiting autophagy to improve the antitumor effect on cancer cells; cellular sensitivity to fulvestrant can be enhanced by increasing autophagic activity [71]. GW2580 treatment significantly increased the proportion of M1 macrophages by inhibiting autophagy to improve cancer outcome [72, 73]. Therefore, the ATS can also be used as a potential indicator of clinical treatment.
Collectively, the potential implications of autophagy in prognosis and therapy response across multiple cancer types were elucidated in this study. The ATGs drived diverse regulatory mechanisms in the tumor microenvironment leading to distinct clinical outcomes. Further, ATS can serve as a reference for predicting patient prognosis and treatment response. Our findings will provide a recommendation for precision medicine in cancers.
Supplementary Material
Supplementary figures and tables.
Acknowledgements
Funding
This work was supported by Open program for Key Laboratory of Tropical Translational Medicine of Ministry of Education (Hainan Medical University) (2020TTM005), Shenzhen Science and Technology Innovation Commission (JCYJ20200109120205924).
Data availability statement
Publicly available datasets were analyzed in this study. The datasets supporting the conclusions of this article are available in the HADb (http://www.autophagy.lu), TCGA (https://portal.gdc.cancer.gov), GEO (https://www.ncbi.nlm.nih.gov/geo), cBioPortal (http://www.cbioportal.org), ICGC (https://dcc.icgc.org) and GDSC (https://www.cancerrxgene.org) databases. Further inquiries can be directed to the corresponding author.
Author contributions
Conceptualization and methodology, J.X. and W.L.; writing—original draft, J.X., H.Y. and X.Z.; data curation and visualization, H.Y., X.Z. and J.Z.; investigation: Z.Z. All authors have read and agreed to the published version of the manuscript.
Competing Interests
The authors have declared that no competing interest exists.
References
1. Chavez-Dominguez R, Perez-Medina M, Lopez-Gonzalez JS, Galicia-Velasco M, Aguilar-Cazares D. The Double-Edge Sword of Autophagy in Cancer: From Tumor Suppression to Pro-tumor Activity. Front Oncol. 2020;10:578418
2. Parzych KR, Klionsky DJ. An overview of autophagy: morphology, mechanism, and regulation. Antioxid Redox Signal. 2014;20:460-73
3. Santana-Codina N, Mancias JD, Kimmelman AC. The Role of Autophagy in Cancer. Annu Rev Cancer Biol. 2017;1:19-39
4. Mizushima N, Komatsu M. Autophagy: renovation of cells and tissues. Cell. 2011;147:728-41
5. Mizushima N, Levine B. Autophagy in Human Diseases. N Engl J Med. 2020;383:1564-76
6. Debnath J, Gammoh N, Ryan KM. Autophagy and autophagy-related pathways in cancer. Nat Rev Mol Cell Biol. 2023;24:560-575
7. Levy JMM, Towers CG, Thorburn A. Targeting autophagy in cancer. Nat Rev Cancer. 2017;17:528-42
8. Li X, He S, Ma B. Autophagy and autophagy-related proteins in cancer. Mol Cancer. 2020;19:12
9. Ye W, Shi Z, Zhou Y, Zhang Z, Zhou Y, Chen B. et al. Autophagy-Related Signatures as Prognostic Indicators for Hepatocellular Carcinoma. Front Oncol. 2022;12:654449
10. Zhou C, Li AH, Liu S, Sun H. Identification of an 11-Autophagy-Related-Gene Signature as Promising Prognostic Biomarker for Bladder Cancer Patients. Biology (Basel). 2021;10:375
11. Chen H, Deng Q, Wang W, Tao H, Gao Y. Identification of an autophagy-related gene signature for survival prediction in patients with cervical cancer. J Ovarian Res. 2020;13:131
12. Jiang GM, Tan Y, Wang H, Peng L, Chen HT, Meng XJ. et al. The relationship between autophagy and the immune system and its applications for tumor immunotherapy. Mol Cancer. 2019;18:17
13. Noman MZ, Buart S, Van Pelt J, Richon C, Hasmim M, Leleu N. et al. The cooperative induction of hypoxia-inducible factor-1 alpha and STAT3 during hypoxia induced an impairment of tumor susceptibility to CTL-mediated cell lysis. J Immunol. 2009;182:3510-21
14. Pua HH, Guo J, Komatsu M, He YW. Autophagy is essential for mitochondrial clearance in mature T lymphocytes. J Immunol. 2009;182:4046-55
15. Tong T, Zhang J, Zhu X, Hui P, Wang Z, Wu Q. et al. Prognostic Autophagy-Related Model Revealed by Integrating Single-Cell RNA Sequencing Data and Bulk Gene Profiles in Gastric Cancer. Front Cell Dev Biol. 2021;9:729485
16. Sui X, Chen R, Wang Z, Huang Z, Kong N, Zhang M. et al. Autophagy and chemotherapy resistance: a promising therapeutic target for cancer treatment. Cell Death Dis. 2013;4:e838
17. Wang X, Wu WKK, Gao J, Li Z, Dong B, Lin X. et al. Autophagy inhibition enhances PD-L1 expression in gastric cancer. J Exp Clin Cancer Res. 2019;38:140
18. Cui J, Yu J, Xu H, Zou Y, Zhang H, Chen S. et al. Autophagy-lysosome inhibitor chloroquine prevents CTLA-4 degradation of T cells and attenuates acute rejection in murine skin and heart transplantation. Theranostics. 2020;10:8051-60
19. Saleem A, Dvorzhinski D, Santanam U, Mathew R, Bray K, Stein M. et al. Effect of dual inhibition of apoptosis and autophagy in prostate cancer. Prostate. 2012;72:1374-81
20. Qin S, Xu L, Yi M, Yu S, Wu K, Luo S. Novel immune checkpoint targets: moving beyond PD-1 and CTLA-4. Mol Cancer. 2019;18:155
21. Zak KM, Grudnik P, Magiera K, Domling A, Dubin G, Holak TA. Structural Biology of the Immune Checkpoint Receptor PD-1 and Its Ligands PD-L1/PD-L2. Structure. 2017;25:1163-74
22. Borst P, Evers R, Kool M, Wijnholds J. A family of drug transporters: the multidrug resistance-associated proteins. J Natl Cancer Inst. 2000;92:1295-302
23. Love MI, Huber W, Anders S. Moderated estimation of fold change and dispersion for RNA-seq data with DESeq2. Genome biology. 2014;15:1-21
24. Zhang H, Meltzer P, Davis S. RCircos: an R package for Circos 2D track plots. BMC bioinformatics. 2013;14:1-5
25. Wu T, Hu E, Xu S, Chen M, Guo P, Dai Z. et al. clusterProfiler 4.0: A universal enrichment tool for interpreting omics data. Innovation (N Y). 2021;2:100141
26. Yu G, Wang LG, Han Y, He QY. clusterProfiler: an R package for comparing biological themes among gene clusters. OMICS. 2012;16:284-7
27. Ashburner M, Ball CA, Blake JA, Botstein D, Butler H, Cherry JM. et al. Gene ontology: tool for the unification of biology. The Gene Ontology Consortium. Nat Genet. 2000;25:25-9
28. Kanehisa M, Goto S. KEGG: kyoto encyclopedia of genes and genomes. Nucleic Acids Res. 2000;28:27-30
29. Subramanian A, Tamayo P, Mootha VK, Mukherjee S, Ebert BL, Gillette MA. et al. Gene set enrichment analysis: a knowledge-based approach for interpreting genome-wide expression profiles. Proc Natl Acad Sci U S A. 2005;102:15545-50
30. Therneau TM, Lumley T. Package 'survival'. R Top Doc. 2015;128:28-33
31. Hanzelmann S, Castelo R, Guinney J. GSVA: gene set variation analysis for microarray and RNA-seq data. BMC Bioinformatics. 2013;14:7
32. Bordi M, De Cegli R, Testa B, Nixon RA, Ballabio A, Cecconi F. A gene toolbox for monitoring autophagy transcription. Cell Death Dis. 2021;12:1044
33. Chen B, Khodadoust MS, Liu CL, Newman AM, Alizadeh AA. Profiling Tumor Infiltrating Immune Cells with CIBERSORT. Methods Mol Biol. 2018;1711:243-59
34. Becht E, Giraldo NA, Lacroix L, Buttard B, Elarouci N, Petitprez F. et al. Estimating the population abundance of tissue-infiltrating immune and stromal cell populations using gene expression. Genome Biol. 2016;17:218
35. Li T, Fu J, Zeng Z, Cohen D, Li J, Chen Q. et al. TIMER2.0 for analysis of tumor-infiltrating immune cells. Nucleic Acids Res. 2020;48:W509-W14
36. Aran D, Hu Z, Butte AJ. xCell: digitally portraying the tissue cellular heterogeneity landscape. Genome Biol. 2017;18:220
37. Yoshihara K, Shahmoradgoli M, Martinez E, Vegesna R, Kim H, Torres-Garcia W. et al. Inferring tumour purity and stromal and immune cell admixture from expression data. Nat Commun. 2013;4:2612
38. Hao Y, Hao S, Andersen-Nissen E, Mauck WM 3rd, Zheng S, Butler A. et al. Integrated analysis of multimodal single-cell data. Cell. 2021;184:3573-87 e29
39. Luo Y, Tao T, Tao R, Huang G, Wu S. Single-Cell Transcriptome Comparison of Bladder Cancer Reveals Its Ecosystem. Front Oncol. 2022;12:818147
40. Wu K, Zeng J, Shi X, Xie J, Li Y, Zheng H. et al. Targeting TIGIT Inhibits Bladder Cancer Metastasis Through Suppressing IL-32. Front Pharmacol. 2021;12:801493
41. Hafemeister C, Satija R. Normalization and variance stabilization of single-cell RNA-seq data using regularized negative binomial regression. Genome Biol. 2019;20:296
42. Zola H, Swart B, Nicholson I, Voss E. Leukocyte and stromal cell molecules: the CD markers. John Wiley & Sons. 2007
43. Sun D, Guan X, Moran AE, Wu LY, Qian DZ, Schedin P. et al. Identifying phenotype-associated subpopulations by integrating bulk and single-cell sequencing data. Nat Biotechnol. 2022;40:527-38
44. Jin S, Guerrero-Juarez CF, Zhang L, Chang I, Ramos R, Kuan CH. et al. Inference and analysis of cell-cell communication using CellChat. Nat Commun. 2021;12:1088
45. Jiang P, Gu S, Pan D, Fu J, Sahu A, Hu X. et al. Signatures of T cell dysfunction and exclusion predict cancer immunotherapy response. Nat Med. 2018;24:1550-8
46. Robin X, Turck N, Hainard A, Tiberti N, Lisacek F, Sanchez J-C. et al. pROC: an open-source package for R and S+ to analyze and compare ROC curves. BMC Bioinformatics. 2011;12:77
47. Mathew R, Karantza-Wadsworth V, White E. Role of autophagy in cancer. Nat Rev Cancer. 2007;7:961-7
48. Yun CW, Lee SH. The Roles of Autophagy in Cancer. Int J Mol Sci. 2018;19:3466
49. Hu CA, Klopfer EI, Ray PE. Human apolipoprotein L1 (ApoL1) in cancer and chronic kidney disease. FEBS Lett. 2012;586:947-55
50. Bhat P, Leggatt G, Waterhouse N, Frazer IH. Interferon-gamma derived from cytotoxic lymphocytes directly enhances their motility and cytotoxicity. Cell Death Dis. 2017;8:e2836
51. Ogretmen B, Hannun YA. Biologically active sphingolipids in cancer pathogenesis and treatment. Nat Rev Cancer. 2004;4:604-16
52. Saddoughi SA, Song P, Ogretmen B. Roles of bioactive sphingolipids in cancer biology and therapeutics. Subcell Biochem. 2008;49:413-40
53. Beach JA, Aspuria PJ, Cheon DJ, Lawrenson K, Agadjanian H, Walsh CS. et al. Sphingosine kinase 1 is required for TGF-beta mediated fibroblastto- myofibroblast differentiation in ovarian cancer. Oncotarget. 2016;7:4167-82
54. Huang LS, Berdyshev E, Mathew B, Fu P, Gorshkova IA, He D. et al. Targeting sphingosine kinase 1 attenuates bleomycin-induced pulmonary fibrosis. FASEB J. 2013;27:1749-60
55. Yin L, Liu J, Dong H, Xu E, Qiao Y, Wang L. et al. Autophagy-related gene16L2, a potential serum biomarker of multiple sclerosis evaluated by bead-based proteomic technology. Neurosci Lett. 2014;562:34-8
56. Ma T, Gu J, Wen H, Xu F, Ge D. BIRC5 Modulates PD-L1 Expression and Immune Infiltration in Lung Adenocarcinoma. J Cancer. 2022;13:3140-50
57. Su C. Survivin in survival of hepatocellular carcinoma. Cancer Lett. 2016;379:184-90
58. Hanna RA, Quinsay MN, Orogo AM, Giang K, Rikka S, Gustafsson AB. Microtubule-associated protein 1 light chain 3 (LC3) interacts with Bnip3 protein to selectively remove endoplasmic reticulum and mitochondria via autophagy. J Biol Chem. 2012;287:19094-104
59. Kanzawa T, Zhang L, Xiao L, Germano IM, Kondo Y, Kondo S. Arsenic trioxide induces autophagic cell death in malignant glioma cells by upregulation of mitochondrial cell death protein BNIP3. Oncogene. 2005;24:980-91
60. Erkan M, Kleeff J, Esposito I, Giese T, Ketterer K, Buchler MW. et al. Loss of BNIP3 expression is a late event in pancreatic cancer contributing to chemoresistance and worsened prognosis. Oncogene. 2005;24:4421-32
61. Umemura A, He F, Taniguchi K, Nakagawa H, Yamachika S, Font-Burgada J. et al. p62, Upregulated during Preneoplasia, Induces Hepatocellular Carcinogenesis by Maintaining Survival of Stressed HCC-Initiating Cells. Cancer Cell. 2016;29:935-48
62. Denk H, Stumptner C, Abuja PM, Zatloukal K. Sequestosome 1/p62-related pathways as therapeutic targets in hepatocellular carcinoma. Expert Opin Ther Targets. 2019;23:393-406
63. Tao S, Drexler I. Targeting Autophagy in Innate Immune Cells: Angel or Demon During Infection and Vaccination? Front Immunol. 2020;11:460
64. Schroder K, Hertzog PJ, Ravasi T, Hume DA. Interferon-gamma: an overview of signals, mechanisms and functions. J Leukoc Biol. 2004;75:163-89
65. Alspach E, Lussier DM, Schreiber RD. Interferon gamma and Its Important Roles in Promoting and Inhibiting Spontaneous and Therapeutic Cancer Immunity. Cold Spring Harb Perspect Biol. 2019;11:a028480
66. Wang X, Lin Y. Tumor necrosis factor and cancer, buddies or foes? Acta Pharmacol Sin. 2008;29:1275-88
67. Montfort A, Colacios C, Levade T, Andrieu-Abadie N, Meyer N, Segui B. The TNF Paradox in Cancer Progression and Immunotherapy. Front Immunol. 2019;10:1818
68. Ozato Y, Kojima Y, Kobayashi Y, Hisamatsu Y, Toshima T, Yonemura Y. et al. Spatial and single-cell transcriptomics decipher the cellular environment containing HLA-G+ cancer cells and SPP1+ macrophages in colorectal cancer. Cell Rep. 2023;42:111929
69. Corallo D, Pastorino F, Pantile M, Mariotto E, Caicci F, Viola G. et al. Autophagic flux inhibition enhances cytotoxicity of the receptor tyrosine kinase inhibitor ponatinib. J Exp Clin Cancer Res. 2020;39:195
70. Mele L, Del Vecchio V, Liccardo D, Prisco C, Schwerdtfeger M, Robinson N. et al. The role of autophagy in resistance to targeted therapies. Cancer Treat Rev. 2020;88:102043
71. Yang F, Xie HY, Yang LF, Zhang L, Zhang FL, Liu HY. et al. Stabilization of MORC2 by estrogen and antiestrogens through GPER1- PRKACA-CMA pathway contributes to estrogen-induced proliferation and endocrine resistance of breast cancer cells. Autophagy. 2020;16:1061-76
72. Moughon DL, He H, Schokrpur S, Jiang ZK, Yaqoob M, David J. et al. Macrophage Blockade Using CSF1R Inhibitors Reverses the Vascular Leakage Underlying Malignant Ascites in Late-Stage Epithelial Ovarian Cancer. Cancer Res. 2015;75:4742-52
73. Jinushi M, Morita T, Xu Z, Kinoshita I, Dosaka-Akita H, Yagita H. et al. Autophagy-dependent regulation of tumor metastasis by myeloid cells. PLoS One. 2017;12:e0179357
Author contact
![]() Corresponding authors: Jiankai Xu (Email: jxuhrbmu.edu.cn) and Weihua Li (Email: 18804511716com).
Corresponding authors: Jiankai Xu (Email: jxuhrbmu.edu.cn) and Weihua Li (Email: 18804511716com).

 Global reach, higher impact