Impact Factor ISSN: 1837-9664




J Cancer 2026; 17(12):2007-2018. doi:10.7150/jca.142907 This issue Cite
Research Paper
Systemic Immune Traits and Candidate Genes in Uveal Melanoma: An Exploratory Mendelian Randomization and Transcriptomic Study
Jianhui Wang1,*, Qi Zhang2,*, Tengteng Yao3,*, Na Sun4,*, Zhaoyang Wang3, 
1. Department of Ophthalmology, Shanghai Tenth People's Hospital, Tongji University School of Medicine, Shanghai, China.
2. School of Clinical Medicine, Xiamen Medical College, Xiamen, Fujian 361023, China.
3. Department of Ophthalmology, Beijing Tongren Eye Center, Beijing Tongren Hospital, Beijing Ophthalmology & Visual Sciences Key Laboratory, Capital Medical University, Beijing, China.
4. Department of Ophthalmology, Children's Hospital of Fudan University, National Pediatric Medical Center of China, Shanghai, China.
* Jianhui Wang, Qi Zhang, Tengteng Yao, and Na Sun contributed equally to this work and share first authorship.
Received 2026-8-21; Accepted 2026-10-15; Published 2026-11-5
Abstract
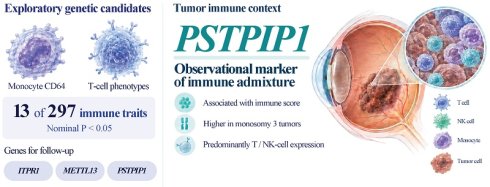
Background: Uveal melanoma (UM) is classified by recurrent genomic alterations and by high-risk, immune-rich tumor states, but the contribution of inherited variation in peripheral immune phenotypes remains unclear. We aimed to identify peripheral immune traits and candidate genes associated with UM and characterize candidate-gene expression in its immune microenvironment. We combined two-sample Mendelian randomization (MR) of 731 immunophenotypes, MR based on whole-blood cis-expression quantitative trait loci (cis-eQTLs), TCGA-UVM bulk transcriptomics, and GSE139829 single-cell RNA sequencing.
Results: Exploratory IVW screening at unadjusted P < 0.05 identified 13 immune-trait candidates for UM among 297 analyzable traits. The corresponding counts were 18 for cutaneous melanoma and 9 for melanocytic nevus, each assessed across 297 traits. The same threshold identified 50 candidate associations among 853 gene-to-UM estimates and 6 of 37 indirect-effect paths. Reverse MR from UM was not estimable because eligible instruments were absent from the candidate-gene cis-eQTL data. In TCGA-UVM (n = 80), PSTPIP1 expression correlated with immune score and was higher in monosomy 3 (M3) tumors. Its survival association was not retained after adjustment for both factors (hazard ratio 1.11, 95% confidence interval 0.58-2.12; P = 0.763). Single-cell mapping detected PSTPIP1 and ITPR1 mainly in T and natural killer cells, whereas METTL13 (previously EEF1AKNMT) showed low, broadly distributed expression. The immune-trait, gene-to-UM, and indirect-effect candidates, together with specimen-level pseudobulk differences between 8 primary and 3 metastatic specimens, did not retain significance after false discovery rate (FDR) correction (all adjusted P ≥ 0.05). These findings support PSTPIP1 as an observational marker of immune admixture in high-risk M3 tumors.
Conclusions: The analysis prioritized monocyte CD64 and T-cell-related phenotypes as exploratory immune-trait candidates for UM. PSTPIP1 expression was associated with immune admixture in high-risk M3 tumors. These findings identify peripheral immune phenotypes and a tumor-associated immune marker for genetic replication and functional or spatial investigation.
Keywords: uveal melanoma, Mendelian randomization, genetic epidemiology, immunogenomics, expression quantitative trait loci, single-cell transcriptomics
Introduction
Uveal melanoma (UM) is the most common primary intraocular malignancy in adults [1, 2]. Although local treatment often achieves durable control of the primary tumor, approximately 50% of patients ultimately develop distant metastases, most often in the liver [1-3]. Defining the biological basis of this marked clinical heterogeneity remains a research objective.
The immune state is an established dimension of UM heterogeneity. Histopathologic, molecular, and transcriptomic studies have linked immune-rich tumors to BAP1-related biology, other high-risk features, and adverse outcomes, rather than to a protective immune response [4-6]. Single-cell studies have further resolved malignant and immune diversity within UM [7, 8]. The limited activity of immune checkpoint blockade in metastatic disease underlines the complexity of this immune context [2, 5, 9, 10].
Most previous studies have characterized immune states within tumors. Whether inherited variation in circulating immune phenotypes is also relevant to UM remains unclear. Circulating immune phenotypes capture variation in immune-cell abundance, composition, activation state, and surface-marker expression, and they can reflect systemic immune responses in cancer [11-13]. Mendelian randomization (MR) provides a framework for assessing whether genetically instrumented immune traits are associated with disease risk while reducing some forms of confounding and reverse causation [14, 15]. The immunophenotype GWAS used here mapped the common genetic determinants of these traits [16].
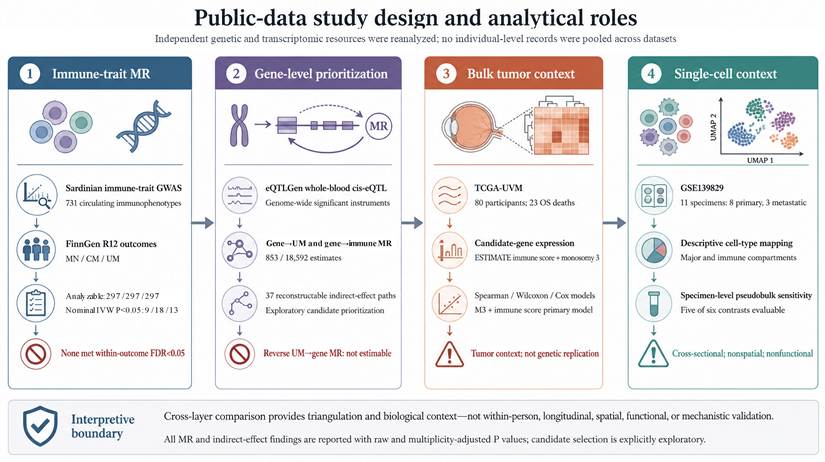
Here, we asked whether systemic immune variation contains UM-relevant genetic signals and whether the prioritized signals could be interpreted in the context of tumor gene expression. We reanalyzed public genetic resources and then examined the nominated traits and genes in independent bulk and single-cell tumor datasets (Figure 1). The datasets represented independent cohorts and different units of analysis, with each data layer providing complementary information.
Public-data study design and analytical roles. Public summary statistics and transcriptomic datasets were reanalyzed using immune-trait MR across melanocytic outcomes, cis-eQTL gene MR, exploratory indirect-effect calculations, TCGA-UVM tumor-context analyses, and descriptive single-cell mapping with a specimen-level pseudobulk sensitivity analysis. The datasets came from independent cohorts, and comparisons across data layers provided complementary biological context.
Materials and Methods
Study design and analytical scope
This study integrated publicly available genetic summary statistics and transcriptomic datasets (Figure 1). The framework comprised 4 components: (1) immune-trait MR across melanocytic outcomes; (2) cis-eQTL-based gene MR and exploratory indirect-effect analysis; (3) bulk tumor transcriptomic analyses; and (4) descriptive single-cell mapping with a specimen-level sensitivity analysis. Each data layer was analyzed separately, without pooling individual-level records across resources.
Public data sources and analytical roles
The genetic analyses used 3 public resources. Immune-trait summary statistics came from a GWAS of 731 immunophenotypes measured in 3,757 Sardinian participants of European ancestry (GWAS Catalog GCST90001391-GCST90002121) [16]. These quantitative peripheral-blood traits described immune-cell abundance, composition defined by surface markers, or activation state; category and accession annotations are provided in Supplementary Tables S1 and S2. Blood cis-eQTL summary statistics were obtained from the eQTLGen Consortium meta-analysis of up to 31,684 individuals [17]. Outcome summary statistics came from FinnGen release R12 for melanocytic nevus (13,357 cases and 486,991 controls), cutaneous melanoma (5,753 cases and 378,749 controls), and UM (332 cases and 378,749 controls) [18]. Thus, the immune-trait GWAS defined the peripheral exposures, eQTLGen supplied whole-blood genetic instruments for gene expression, and FinnGen supplied the melanocytic outcomes. These cohorts were independent.
Tumor-context analyses used TCGA-UVM (n = 80) and GSE139829 (11 specimens: 8 primary and 3 metastatic UM) [8]. TCGA-UVM supplied bulk tumor expression, a continuous ESTIMATE immune score, segment-derived chromosome 3 status, clinical variables, and overall-survival follow-up. GSE139829 supplied single-cell expression for descriptive cellular localization and a cross-sectional lesion-type sensitivity analysis. All survival analyses in Figure 3 used TCGA-UVM data. The tumor datasets were independent of the genetic resources and of one another.
Immune-trait MR across melanocytic outcomes
Two-sample MR analyses were performed using TwoSampleMR [15]. Analyses began with the source panel of 731 immune phenotypes. Independent exposure-associated variants were selected at P < 5 × 10⁻⁸ and clumped using a 1000 Genomes European reference panel (10,000-kb window; r² < 0.001) [19]. Instrument strength was evaluated for each variant as F = [R² × (N - 2)]/(1 - R²) [20, 21], and F > 10 was required. Exposure and outcome associations were harmonized by effect allele, and palindromic variants with ambiguous strand orientation were excluded. Only traits with at least 3 valid SNPs after harmonization were retained, yielding 297 traits for each outcome (Supplementary Table S1). The inverse-variance weighted (IVW) method was the primary estimator. Unadjusted P < 0.05 was used only to prioritize exploratory signals. Benjamini-Hochberg false discovery rate (FDR) adjustment was performed separately across the retained trait estimates for each outcome, and both raw and adjusted P values were considered. MR Steiger directionality tests were performed as a sensitivity analysis for the 13 UM traits selected at unadjusted P < 0.05. These tests used case-control outcome variance under 6 plausible UM prevalence assumptions and did not serve as an additional discovery filter.
Gene MR and exploratory indirect-effect analysis
To prioritize candidate genes related to the UM-associated immune signals, we combined whole-blood cis-eQTL MR with a 2-step MR analysis of indirect effects [22]. Cis-eQTL instruments were selected at P < 5 × 10⁻⁸, clumped at r² < 0.001, and required F > 10. The harmonized analysis comprised 853 gene-to-UM estimates, 18,592 unique gene-to-immune-trait estimates, and 37 gene-immune-UM paths. Indirect effects were calculated as the product of the gene-to-immune-trait and immune-trait-to-UM coefficients, with standard errors derived by the delta method; direct effects and the proportion mediated were retained as descriptive quantities. Benjamini-Hochberg FDR correction was applied to the 853 gene-to-UM family, the 18,592 gene-to-immune-trait family, and the 37 indirect-effect family; within-trait FDR values were additionally retained for gene-to-immune-trait screening. The 2 steps used summary statistics from independent cohorts to prioritize exploratory indirect effects. Full estimates and FDR-adjusted values are reported in Supplementary Table S3.
MR sensitivity and reverse-direction analyses
Sensitivity analyses included Cochran's Q, the MR-Egger intercept, MR-PRESSO, and leave-one-out analyses when the number of instruments permitted these procedures. They were interpreted as robustness checks for the primary IVW estimates. Among the 13 UM immune traits selected at unadjusted P < 0.05, all instruments met P < 5 × 10⁻⁸ and F > 10. None of the available heterogeneity, Egger-intercept, or MR-PRESSO global tests was significant at unadjusted P < 0.05, and the MR Steiger test supported the exposure-to-outcome direction under all 6 prevalence assumptions. Reverse MR was evaluated using FinnGen UM as the exposure and 16 candidate gene-expression outcomes. At P < 5 × 10⁻⁸, 1 UM-associated variant was identified but was not available in the candidate-gene cis-eQTL data. An exploratory P < 1 × 10⁻⁵ analysis yielded 7 clumped variants, again with none available in these data. Reverse MR was therefore not estimable (Supplementary Table S3).
Statistical power and minimum detectable odds ratios
We performed a retrospective design-sensitivity analysis for all 297 retained immune-trait-to-UM analyses. Using the binary-outcome MR approximation described by Burgess [23], we calculated minimum detectable odds ratios (MDORs) for 80% power with 332 cases and 378,749 controls. For each retained instrument, we approximated the proportion of exposure variance explained as F/(F + Nₓ - 2), where F = (βₓ/SEₓ)² and Nₓ was the variant-specific exposure sample size, and summed these values across the existing LD-pruned instrument set. The resulting R² values are summary-derived approximations to the exposure variance explained. Effects were expressed per 1-SD increase in the analysis trait under this approximation, not in original physiological units. Invalid summed R² values were retained as not estimable rather than truncated.
The approximate standard error of the standardized log odds ratio was calculated as 1/√[Nₒs(1 - s)R²], where Nₒ was the total outcome sample size and s was the case fraction. We numerically solved the two-sided normal power function for 80% power at α = 0.05 and at α = 0.05/297. The Bonferroni threshold provided a conservative reference; power for the data-dependent BH-FDR procedure was not estimated. Increasing-risk and reciprocal decreasing-risk thresholds were reported without using the observed MR odds ratios. Calculations were implemented in Python, with inputs, assumptions, and all 297 records reported in Supplementary Table S4.
TCGA-UVM bulk transcriptomic analyses
TCGA-UVM was the sole source of data for the tumor-expression, molecular, and survival analyses shown in Figure 3. RNA-seq transcripts-per-million (TPM) expression profiles were transformed as log₂(TPM + 1) and matched to patient-level overall survival, clinical variables, segment-derived monosomy 3 (M3), and molecular annotations. Candidate-gene analyses used ITPR1, METTL13 (previously EEF1AKNMT; HGNC:24248), and PSTPIP1. A precomputed ESTIMATE immune score was used as a continuous summary of bulk immune admixture [24]. Pathologic stage was collapsed into Stage I-II versus Stage III-IV; available A-C suffixes were retained during matching, and the single missing stage value was not imputed.
For each of the 3 candidate genes, association with the continuous immune score was assessed using a 2-sided Spearman correlation, and expression was compared between disomy 3 and M3 tumors using a 2-sided Wilcoxon rank-sum test. Benjamini-Hochberg correction was applied across the 3 prespecified genes within each analysis family.
Survival was assessed using Kaplan-Meier curves and Cox proportional-hazards regression [25]. Candidate-gene expression was standardized and modeled continuously. For each gene, the prespecified models were as follows: gene alone; gene plus age, sex, and stage group; gene plus immune score; gene plus M3; gene plus immune score and M3 (the primary multivariable model); and gene plus age, immune score, and M3. Benjamini-Hochberg correction was applied across the 3 candidate-gene terms within each model. Because TCGA-UVM contained 80 participants and 23 overall-survival events, models were kept parsimonious and no outcome-optimized expression cutoff was used. Proportional-hazards assumptions were assessed using Schoenfeld residuals (Supplementary Figure S2). Because the immune-score term showed a nominal deviation from the proportional-hazards assumption in the primary PSTPIP1 model (P = 0.036; global test P = 0.070), an extended Cox sensitivity model allowed the immune-score coefficient to vary with log(time) (Supplementary Figure S2). Median-split survival was retained only as a descriptive secondary analysis.
GSE139829 single-cell RNA-seq analyses
Raw 10× Genomics matrices from GSE139829 [8] were processed in Seurat [26]. The final quality-controlled Seurat object contained 48,289 cells from 11 specimens (8 primary and 3 metastatic UM) and retained integer raw counts for downstream specimen-level aggregation. Retained cells satisfied the quality-control thresholds nCount_RNA > 400, 100 ≤ nFeature_RNA ≤ 8,000, and mitochondrial fraction < 10%. Ambient RNA contamination was estimated using DecontX, and cells with estimated contamination ≥ 0.30 were excluded [27]. Data were normalized using LogNormalize (scale factor = 10,000), and highly variable genes were selected using the vst method (nfeatures = 1,865). After regressing out nCount_RNA and mitochondrial fraction, principal component analysis was performed; the first 20 principal components were used for graph construction, t-SNE, and UMAP. No cross-sample CCA or Harmony integration was applied to this object. Louvain clustering was applied at resolution = 3 for the global atlas. Major malignant, immune, stromal, and vascular compartments were annotated using canonical marker genes and marker panels supported by module scores [8, 26].
Immune cells were extracted and reclustered (resolution = 0.6) to resolve major lymphoid and myeloid populations, and clustering stability across resolutions was assessed using clustree [28]. These cell-level panels, stratified by immune subtype and by condition, were retained only to describe candidate-gene distribution; pooled cells were not used for lesion-type inference. For a post hoc sensitivity analysis of primary and metastatic lesions, we used the same object and retained the existing major-cell-type labels, without reclustering or relabeling by condition. Integer raw counts were aggregated to specimen-by-cell-type pseudobulk profiles. Cell-type strata required at least 10 cells per specimen (Supplementary Figure S3), and edgeR quasi-likelihood negative binomial generalized log-linear models with trimmed mean of M-values (TMM) normalization were fitted, with the specimen as the unit of analysis. A targeted family of 6 contrasts (3 genes × myeloid/TAM and T-cell strata) was defined before model fitting; 5 were evaluable, whereas METTL13 in the T-cell stratum was removed by the low-expression filter. Benjamini-Hochberg adjustment was applied across all 6 contrasts in this family. Lesion types were compared cross-sectionally at the specimen level.
Statistical analysis
Final MR effect estimation, TCGA-UVM statistical analyses, and specimen-level pseudobulk analyses were performed using R (version 4.5.2); immune-trait MR used TwoSampleMR 0.7.1. Correlations between continuous variables were assessed using Spearman correlation, and all tests were 2-sided. For exploratory prioritization in the high-dimensional MR and pseudobulk analyses, we used unadjusted P < 0.05 to identify candidate associations for further investigation. Benjamini-Hochberg FDR < 0.05 defined significance after multiple testing within the analysis families: retained immune traits for each of melanocytic nevus, cutaneous melanoma, and UM; 853 gene-to-UM estimates; 18,592 gene-to-immune-trait estimates; 37 indirect effects; 3 candidate-gene versus immune-score correlations; 3 candidate-gene comparisons by M3 status; the 3 candidate-gene terms within each Cox model; and a targeted pseudobulk family of 6 contrasts (5 evaluable). Raw P values and FDR-adjusted values are reported together where applicable. Tumor-context and post hoc sensitivity analyses were interpreted as exploratory even when FDR-adjusted P values were below 0.05.
Use of generative AI-assisted tools
OpenAI ChatGPT and OpenAI Codex were used to assist with language editing, formatting, preparation and execution of analysis code, checking analytical outputs, and figure formatting. OpenAI ImageGen was used to prepare the study-design schematic in Figure 1 and the graphical abstract from author-specified scientific content. All AI-assisted content and analytical outputs were reviewed and verified by the authors, who take full responsibility for the accuracy and integrity of the final manuscript.
Results
Exploratory immune-trait signals across melanocytic outcomes
To identify potential immune-trait signals, we used unadjusted IVW P < 0.05 as an exploratory screening threshold. This screen identified 9 of 297 traits for melanocytic nevus, 18 of 297 for cutaneous melanoma, and 13 of 297 for UM. These candidates did not meet within-outcome FDR < 0.05 (minimum FDR: melanocytic nevus, 0.519; cutaneous melanoma, 0.167; UM, 0.331; Figure 2A). No trait was shared across all 3 outcomes. No candidate trait for melanocytic nevus was shared with either melanoma outcome; cutaneous melanoma and UM shared two candidate traits: forward scatter area (FSC-A) on myeloid dendritic cells (GCST90001963) and FSC-A on plasmacytoid dendritic cells (GCST90001964) (Figure 2B).
Exploratory immune-trait MR across melanocytic outcomes and gene-immune-UM indirect-effect prioritization. (A) Forest plot of immune-cell traits selected at unadjusted P < 0.05 for melanocytic nevus (9 of 297 analyzable traits), cutaneous melanoma (18 of 297), and UM (13 of 297), with outcomes from FinnGen release R12. Odds ratios with 95% confidence intervals and raw IVW P values are shown; none met within-outcome FDR < 0.05. (B) Pairwise overlap among the selected traits. No trait was shared across all 3 outcomes; cutaneous melanoma and UM shared 2 traits, whereas melanocytic nevus shared none with either melanoma outcome. (C) Exploratory indirect-effect summary for ITPR1, METTL13, and PSTPIP1. Product-of-coefficients estimates are shown with raw and FDR-adjusted P values; no indirect effect shown here met global FDR < 0.05.
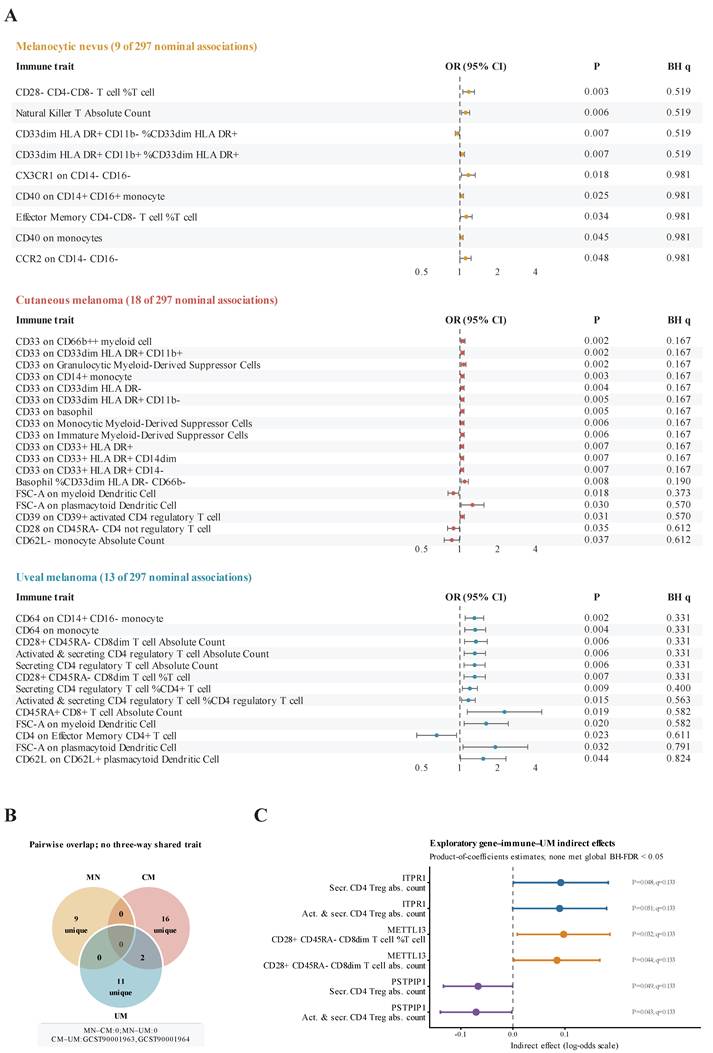
The 13 UM candidates identified through this exploratory screen included several peripheral T-cell phenotypes: counts and proportions of secreting and of activated/secreting CD4 regulatory T cells, CD28+CD45RA- CD8dim phenotypes, and CD45RA+ CD8 T-cell abundance, together with a smaller number of innate-cell features, including the two strongest signals, CD64 expression on CD14+CD16- monocytes and on monocytes overall (Figure 2A). Twelve estimates were risk-increasing; the remaining estimate, CD4 expression on effector-memory CD4 T cells, was risk-decreasing. These measurements characterize circulating immune phenotypes, whose distribution across trait categories was summarized descriptively. At α = 0.05 and 80% power, approximate increasing-risk MDORs ranged from 1.18 to 2.62 per 1-SD increase in the analysis trait among estimable UM analyses, indicating that smaller trait-specific effects could be missed; full results and assumptions are provided in Supplementary Table S4.
Gene MR and exploratory mediation analysis
Using the same exploratory screening threshold (unadjusted P < 0.05), the gene-level analysis prioritized 50 candidate associations among 853 gene-to-UM estimates. The gene-to-immune-trait analysis yielded 939 candidates among 18,592 unique estimates, with 1 association meeting global FDR < 0.05. Of 37 indirect-effect paths, 6 met the exploratory screening threshold, including 5 of the 6 paths shown for ITPR1, METTL13, and PSTPIP1.
ITPR1 and PSTPIP1 shared two candidate mediators: the absolute counts of secreting and activated/secreting CD4 regulatory T cells. On the UM log-odds scale, ITPR1 showed positive indirect-effect estimates (β = 0.092 and 0.090; P = 0.048 and 0.051, respectively). PSTPIP1 showed inverse estimates through the same mediators (β = -0.067 and -0.071; P = 0.049 and 0.043, respectively). For METTL13, the CD28+CD45RA- CD8dim T-cell proportion within T cells and absolute count had positive estimates (β = 0.097 and 0.085; P = 0.032 and 0.044, respectively). Global FDR-adjusted P values were ≥ 0.05 for the gene-to-UM and indirect-effect candidates and six main gene-immune links (q = 0.133 for all six displayed paths); the 95% confidence intervals and complete estimates are reported in Figure 2C and Supplementary Table S3. Reverse MR was not estimable because no UM instrument was available in the candidate-gene cis-eQTL data after harmonization. These results guided selection of the 3 genes for exploratory characterization in the tumor datasets.
PSTPIP1 expression tracks immune score and monosomy 3 in TCGA-UVM
We next examined the expression of MR-prioritized genes in relation to the bulk tumor immune context in TCGA-UVM. PSTPIP1 expression was positively correlated with the ESTIMATE immune score (Spearman ρ = 0.600; P = 3.99 × 10⁻⁹; BH q = 1.20 × 10⁻⁸; Figure 3A). In contrast, ITPR1 (ρ = 0.032; P = 0.778; q = 0.786) and METTL13 (ρ = -0.031; P = 0.786; q = 0.786) showed no corresponding association. These findings link PSTPIP1 expression to bulk immune admixture in this cohort.
Candidate-gene expression in relation to immune score, monosomy 3 (M3), and overall survival in TCGA-UVM. (A) Patient-level associations between expression of ITPR1, METTL13, and PSTPIP1 and the ESTIMATE immune score (n = 80). Points represent individual tumors; lines and shaded bands show linear fits and 95% confidence bands for visualization. Statistical inference was based on 2-sided Spearman correlation with Benjamini-Hochberg correction across the 3 prespecified genes. (B) Candidate-gene expression according to segment-derived chromosome 3 status (disomy 3, n = 38; monosomy 3, n = 42). Boxes show medians and interquartile ranges, whiskers extend to 1.5 times the interquartile range, and points represent individual tumors. P values are from 2-sided Wilcoxon rank-sum tests with Benjamini-Hochberg correction across the 3 genes. (C) Cox proportional-hazards estimates for overall survival per 1-SD higher continuous gene expression across prespecified models. The primary multivariable model contained the gene, ESTIMATE immune score, and M3 and is highlighted in red. The full cohort comprised 80 participants with 23 deaths; the clinical stage-adjusted model included 79 participants with 22 deaths because 1 pathologic-stage value was missing. Exact coefficients and adjusted P values are reported in Additional file 4, and proportional-hazards diagnostics are presented in Supplementary Figure S2 (Additional file 1).
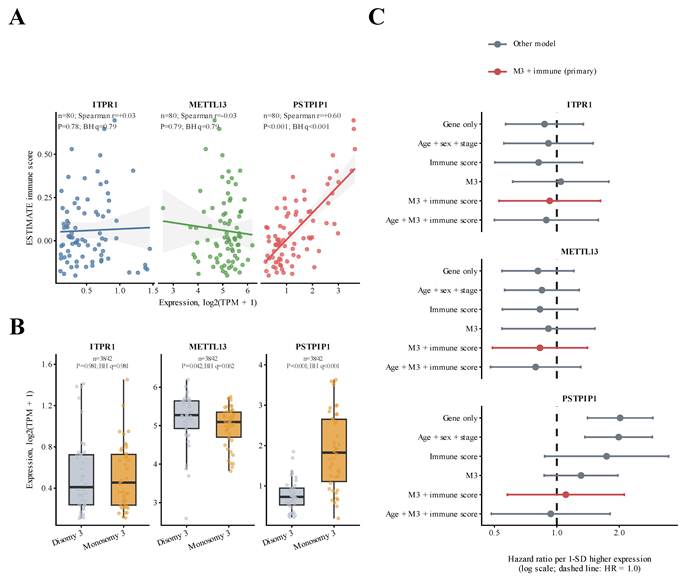
When tumors were compared by chromosome 3 status, PSTPIP1 expression was higher in monosomy 3 (M3) than in disomy 3 tumors (median log₂[TPM + 1], 1.83 versus 0.73; Wilcoxon P = 7.82 × 10⁻⁸; BH q = 2.35 × 10⁻⁷; Figure 3B). METTL13 showed a smaller nominal difference in the opposite direction (5.09 versus 5.27; P = 0.0416; q = 0.0624), whereas ITPR1 did not differ by M3 status (0.45 versus 0.41; P = 0.981; q = 0.981). Thus, among the 3 candidates, the strongest bulk association was that of PSTPIP1, which tracked both the immune score and M3 high-risk status.
In the primary multivariable model containing M3 and immune score, PSTPIP1 was not independently associated with overall survival (HR 1.11, 95% CI 0.58-2.12; P = 0.763; q = 0.784), whereas M3 remained associated with survival (HR 10.68, 95% CI 2.26-50.32; P = 0.0028; Figure 3C and Supplementary Figure S2A). An extended Cox sensitivity model allowing the immune-score coefficient to vary with log(time) gave a similar PSTPIP1 estimate (HR 1.08, 95% CI 0.56-2.10; P = 0.809; Supplementary Figure S2). In contrast, continuous standardized PSTPIP1 expression was associated with survival in the univariable model (HR 2.02, 95% CI 1.41-2.90; P = 1.44 × 10⁻⁴; BH q = 4.31 × 10⁻⁴) and after adjustment for age, sex, and stage (HR 1.99, 95% CI 1.37-2.89; P = 3.24 × 10⁻⁴; q = 9.73 × 10⁻⁴). The descriptive median-split analysis also associated higher PSTPIP1 expression with shorter overall survival (Cox HR 5.48, 95% CI 1.86-16.15; Wald P = 0.002; Supplementary Figure S1). Together, these results indicate that the survival association was attenuated after immune admixture and M3 were taken into account.
Candidate-gene expression maps to immune compartments in GSE139829
We mapped the candidate genes in the GSE139829 single-cell atlas (11 specimens: 8 primary and 3 metastatic UM; Figure 4A; quality control in Supplementary Figure S4). The atlas resolved major malignant, immune, stromal, and vascular compartments. Descriptive feature plots, average-expression summaries, and detection fractions indicated that ITPR1, METTL13, and PSTPIP1 were more readily detected in some immune compartments than in malignant cells (Figure 4B-D).
Descriptive single-cell distribution of candidate genes across UM compartments. (A) t-SNE embedding of GSE139829 (11 specimens: 8 primary and 3 metastatic UM) colored by major cell type. (B-D) Feature plots, row-scaled average-expression heatmap, and dot plot for ITPR1, METTL13, and PSTPIP1 across major compartments. (E-F) Immune-focused reclustering and candidate-gene feature plots across annotated immune subtypes. These cell-level panels show descriptive, nonspatial expression patterns. Condition-stratified pooled-cell summaries in Supplementary Figure S5 are descriptive only. Specimen-level pseudobulk comparisons are reported as a sensitivity analysis in Supplementary Figure S6; 5 of 6 targeted contrasts were evaluable, and none met targeted FDR < 0.05.
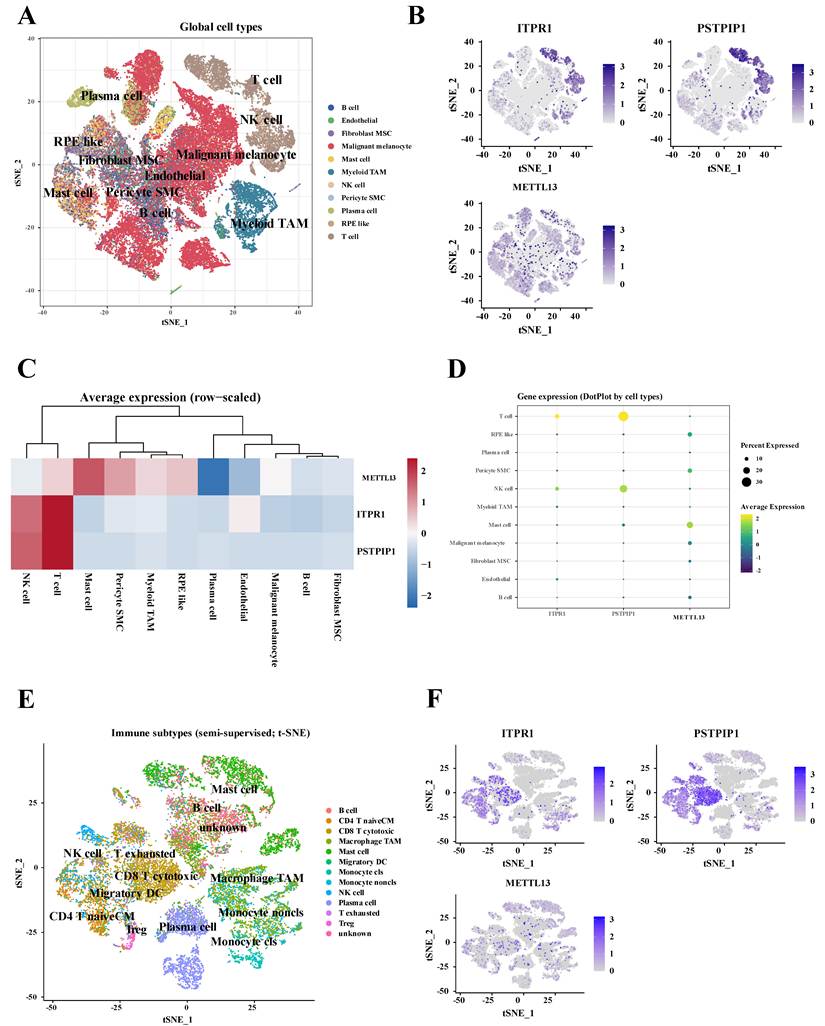
Within immune cells, descriptive mapping suggested that ITPR1 was distributed across T-lineage and myeloid/TAM regions, whereas PSTPIP1 was more readily detected in cells annotated as cytotoxic or exhausted T cells, and METTL13 showed low expression that was most evident in mast cells (Figure 4E-F; Supplementary Figure S5). The condition-stratified composition and dot-plot panels in Supplementary Figure S5 were treated as pooled-cell descriptions only; no cell-level P values were interpreted.
The specimen-level pseudobulk sensitivity analysis did not identify an association that remained significant after targeted FDR correction (Supplementary Figure S6). ITPR1 expression was higher in metastatic than in primary lesions within the myeloid/TAM stratum (log₂ fold change 1.35; raw P = 0.0088), but the targeted FDR was 0.0529. The other evaluable gene-by-stratum comparisons had targeted FDR values ≥ 0.240, and METTL13 in the T-cell stratum was excluded because of low expression. The cross-sectional comparison thus provided a descriptive ITPR1 expression signal.
Discussion
This study combined genetic analyses of peripheral immune traits with bulk and single-cell tumor transcriptomic analyses to examine systemic immune signals in UM. The genetic analyses prioritized exploratory immune-trait and gene candidates, while the tumor datasets characterized the candidate genes in relation to immune admixture, M3 status, and cellular expression. The main findings were exploratory immune-trait signals involving monocyte CD64 and several T-cell phenotypes, alongside tumor-level associations of PSTPIP1 with immune admixture and M3 status. These tumor associations support PSTPIP1 as an observational marker of the immune context of high-risk UM.
The two strongest nominal UM signals involved CD64 (FcγRI) expression on monocytes, and, unlike several T-cell traits, their instruments did not include variants with minor allele frequency < 1%. Macrophages, predominantly of the M2 phenotype, infiltrate UM, and their density has been associated with poor prognosis [29, 30]; whether inherited variation in monocyte CD64 expression relates to this myeloid component remains to be tested. The remaining nominal traits encompassed several T-cell differentiation or activation phenotypes, including regulatory CD4 T-cell measures, CD28+CD45RA- CD8dim phenotypes, CD45RA+ CD8 T-cell abundance, and CD4 expression on effector-memory CD4 T cells. High-risk UM contains immunosuppressive infiltrates, including LAG3-expressing CD8+ T cells and tumor-associated macrophages [6, 8]; however, these genetically instrumented peripheral traits index systemic variation relevant to susceptibility rather than intratumoral states, and several of them shared instruments.
Among the candidate genes, PSTPIP1 showed the clearest relationship with the bulk tumor immune context. Its positive association with immune score and higher expression in M3 tumors support its interpretation as an observational marker of immune admixture in high-risk M3 tumors. It was not independently associated with survival after joint adjustment for immune score and M3. Consistent with this interpretation, PSTPIP1 was detected mainly in T and natural killer cells (Figure 4B-D), suggesting that its bulk expression largely reflects immune-cell content. Accordingly, the nominally inverse association of genetically predicted whole-blood PSTPIP1 expression with UM risk (Supplementary Table S3) and its higher tumor expression in M3 index different quantities and should not be read as concordant or conflicting evidence. ITPR1 and METTL13 showed no comparable bulk associations, and higher ITPR1 expression in metastatic myeloid/TAM pseudobulk profiles did not remain significant after targeted FDR correction.
The genetic and transcriptomic analyses address complementary aspects of UM immunobiology. The genetic resources describe inherited variation in circulating immune traits and gene expression, whereas the tumor datasets describe tissue state and cellular composition. Nominal signals overlapped little across UM, cutaneous melanoma, and melanocytic nevus; given the limited power, this does not establish outcome specificity, although it is compatible with the distinct genetic origins of uveal and cutaneous melanomas [2]. Independent replication of the genetic signals, followed by evaluation of monocyte CD64, regulatory T-cell features, and candidate-gene expression in cohorts with established UM molecular markers, would help assess their clinical relevance. Spatial profiling and perturbational studies would clarify the cellular sources and functional roles of the prioritized genes.
Several limitations qualify this exploratory interpretation. None of the prioritized immune-trait-to-UM, gene-to-UM, or indirect-effect associations survived FDR correction, and no targeted pseudobulk comparison remained significant after correction. The genetic resources were predominantly of European ancestry, which limits generalizability, and differences in allele frequencies and LD between the Sardinian and Finnish populations may affect instrument transferability [16, 18], particularly for the regulatory T-cell and CD28+CD45RA- CD8dim traits, whose instruments consisted mainly of rare variants (minor allele frequency < 1% in the exposure GWAS). Single-variant cis-eQTL instruments precluded MR-Egger and MR-PRESSO testing; pleiotropy and shared causal variants remain unresolved. The limited UM case count (332), TCGA-UVM cohort (80 participants and 23 deaths), and single-cell sample (8 primary and 3 metastatic specimens) constrain precision and power. With a median minimum detectable odds ratio of 1.59 per SD at α = 0.05 (Supplementary Table S4), smaller immune-trait effects on UM cannot be excluded, and reverse MR was not estimable with the available instruments. The lesion-type comparison was cross-sectional, and the independent genetic and transcriptomic datasets do not establish a continuous causal pathway from peripheral immune traits to the tumor microenvironment.
Conclusions
These public-data secondary analyses provide an exploratory framework for prioritizing systemic immune traits and candidate genes relevant to UM. The results support further evaluation of monocyte CD64 and T-cell-related peripheral phenotypes and of ITPR1, METTL13, and PSTPIP1. These findings remain exploratory after multiple-testing correction and require independent replication before causal or clinical interpretation.
Abbreviations
BAP1: BRCA1-associated protein 1; CI: confidence interval; cis-eQTL: cis-expression quantitative trait locus; FDR: false discovery rate; GWAS: genome-wide association study; HR: hazard ratio; IVW: inverse-variance weighted; M3: monosomy 3; LD: linkage disequilibrium; MDOR: minimum detectable odds ratio; MR: Mendelian randomization; SNP: single nucleotide polymorphism; TAM: tumor-associated macrophage; TCGA: The Cancer Genome Atlas; TPM: transcripts per million; UM: uveal melanoma.
Supplementary Material
Supplementary Figures S1-S6. Supplementary Figure S1. PSTPIP1 median-split overall survival in TCGA-UVM. Descriptive Kaplan-Meier analysis of 40 high-expression and 40 low-expression tumors. Supplementary Figure S2. PSTPIP1 multivariable Cox model diagnostics and sensitivity analysis. Proportional-hazards diagnostics and the time-varying immune-score sensitivity model. Supplementary Figure S3. Specimen inventory and pseudobulk eligibility in GSE139829. Specimen-level cell counts and eligibility for the prespecified myeloid/TAM and T-cell strata. Supplementary Figure S4. Single-cell RNA-seq quality control and global clustering of GSE139829. Quality-control distributions, dimensionality reduction, clustering, and marker-based annotation. Supplementary Figure S5. Descriptive immune-subset reclustering and candidate-gene expression by subtype and lesion type. Pooled-cell panels are presented for visualization without cell-level statistical inference. Supplementary Figure S6. Specimen-level pseudobulk sensitivity analysis of the 3 nominated genes in GSE139829. Six prespecified contrasts were retained, five were evaluable, and none met targeted FDR < 0.05.

Supplementary Tables S1-S3. Screening of all 731 immune traits for each outcome, with inclusion and exclusion reasons; immune-trait annotations and accession mapping; forward MR and sensitivity outputs; gene MR, exploratory indirect-effect, and reverse-MR feasibility results.
Supplementary Table S4. Minimum detectable odds ratios for all 297 retained immune-trait-to-UM analyses. Approximate 80% power thresholds at nominal α = 0.05 and a Bonferroni reference α = 0.05/297 are provided, with instrument counts, summary-derived R², analysis-trait units, and one retained not-estimable record. These thresholds do not replace the BH-FDR analysis.
Source data for Figure 3 and Supplementary Figure S2.
Acknowledgements
The authors thank the participants, investigators, and staff of FinnGen, eQTLGen, GWAS Catalog, TCGA, and GEO studies for generating and sharing the publicly available data used in this work. OpenAI ChatGPT, OpenAI Codex, and OpenAI ImageGen were used as described in the Materials and Methods.
Funding
This work was supported by the National Natural Science Foundation of China (NSFC) (Grant Nos. 82571223 and 82401280), the Beijing Local Development Funds for Traditional Chinese Medical Science and Technology (Project No. BJZYZD-2025-11), and the Beijing High-level Innovation and Entrepreneurship Talent Support Program (Gaochuang Program), Healthcare Platform-Dengfeng/Qingmiao/Chunlei Project (Task No. G202511028). The funders had no role in study design, data collection and analysis, decision to publish, or preparation of the manuscript.
Ethics approval and consent to participate
This study was a secondary analysis of publicly available, de-identified datasets (FinnGen R12, eQTLGen, GWAS Catalog, TCGA-UVM, and GEO) and did not involve newly recruited human participants. Institutional review board approval and informed consent were therefore not required. All original studies obtained institutional ethics approval and participant informed consent as applicable, and adhered to the tenets of the Declaration of Helsinki.
Data availability
All data analyzed in this study are publicly available. GWAS summary statistics for melanocytic outcomes were obtained from FinnGen release R12 (https://www.finngen.fi/en). Whole-blood cis-eQTL summary statistics were downloaded from the eQTLGen Consortium (https://www.eqtlgen.org/). Immune-cell trait GWAS summary statistics (731 immunophenotypes; GCST90001391-GCST90002121) were obtained from the GWAS Catalog. Bulk tumor transcriptomic, immune-score, molecular, and clinical data were accessed from TCGA-UVM via the Genomic Data Commons and associated public resources. Single-cell RNA-seq data were obtained from Gene Expression Omnibus (GSE139829). Derived results supporting the findings are included in this article and its supplementary files. Analysis code is available from the corresponding author on reasonable request.
Authors' contributions
JW: Conceptualization, Methodology, Formal analysis, Investigation, Data curation, Visualization, Writing - original draft. QZ: Methodology, Formal analysis, Investigation, Data curation, Writing - review & editing. TY: Methodology, Investigation, Resources, Funding acquisition, Writing - review & editing. NS: Investigation, Resources, Data curation, Writing - review & editing. ZW: Conceptualization, Supervision, Project administration, Funding acquisition, Writing - review & editing. All authors had full access to all the data in the study, approved the final manuscript, and had final responsibility for the decision to submit for publication.
Competing Interests
The authors have declared that no competing interest exists.
References
1. Carvajal RD, Sacco JJ, Jager MJ. et al. Advances in the clinical management of uveal melanoma. Nat Rev Clin Oncol. 2023;20:99-115
2. Jager MJ, Shields CL, Cebulla CM. et al. Uveal melanoma. Nat Rev Dis Primers. 2020;6:24
3. Bustamante P, Piquet L, Landreville S, Burnier JV. Uveal melanoma pathobiology: Metastasis to the liver. Semin Cancer Biol. 2021;71:65-85
4. Matsuo H, Kamatani T, Hamba Y, Boroevich KA, Tsunoda T. Association between high immune activity and worse prognosis in uveal melanoma and low-grade glioma in TCGA transcriptomic data. BMC Genomics. 2022;23:351
5. Leonard-Murali S, Bhaskarla C, Yadav GS. et al. Uveal melanoma immunogenomics predict immunotherapy resistance and susceptibility. Nat Commun. 2024;15:2863
6. Figueiredo CR, Kalirai H, Sacco JJ. et al. Loss of BAP1 expression is associated with an immunosuppressive microenvironment in uveal melanoma, with implications for immunotherapy development. J Pathol. 2020;250:420-439
7. Pandiani C, Strub T, Nottet N. et al. Single-cell RNA sequencing reveals intratumoral heterogeneity in primary uveal melanomas and identifies HES6 as a driver of the metastatic disease. Cell Death Differ. 2021;28:1990-2000
8. Durante MA, Rodriguez DA, Kurtenbach S. et al. Single-cell analysis reveals new evolutionary complexity in uveal melanoma. Nat Commun. 2020;11:496
9. Algazi AP, Tsai KK, Shoushtari AN. et al. Clinical outcomes in metastatic uveal melanoma treated with PD-1 and PD-L1 antibodies. Cancer. 2016;122:3344-3353
10. Hoefsmit EP, Rozeman EA, Van TM. et al. Comprehensive analysis of cutaneous and uveal melanoma liver metastases. J Immunother Cancer. 2020;8:e001501
11. Griffiths JI, Wallet P, Pflieger LT. et al. Circulating immune cell phenotype dynamics reflect the strength of tumor-immune cell interactions in patients during immunotherapy. Proc Natl Acad Sci U S A. 2020;117:16072-16082
12. Hwang M, Canzoniero JV, Rosner S. et al. Peripheral blood immune cell dynamics reflect antitumor immune responses and predict clinical response to immunotherapy. J Immunother Cancer. 2022;10:e004688
13. Hyung J, Lee H, Jin H. et al. Tumor immune-gene expression profiles and peripheral immune phenotypes associated with clinical outcomes of locally advanced pancreatic cancer following FOLFIRINOX. ESMO Open. 2022;7:100484
14. Sanderson E, Glymour MM, Holmes MV. et al. Mendelian randomization. Nat Rev Methods Primers. 2022;2:6
15. Hemani G, Zheng J, Elsworth B. et al. The MR-Base platform supports systematic causal inference across the human phenome. Elife. 2018;7:e34408
16. Orrù V, Steri M, Sidore C. et al. Complex genetic signatures in immune cells underlie autoimmunity and inform therapy. Nat Genet. 2020;52:1036-1045
17. Võsa U, Claringbould A, Westra HJ. et al. Large-scale cis- and trans-eQTL analyses identify thousands of genetic loci and polygenic scores that regulate blood gene expression. Nat Genet. 2021;53:1300-1310
18. Kurki MI, Karjalainen J, Palta P. et al. FinnGen provides genetic insights from a well-phenotyped isolated population. Nature. 2023;613:508-518
19. Purcell S, Neale B, Todd-Brown K. et al. PLINK: a tool set for whole-genome association and population-based linkage analyses. Am J Hum Genet. 2007;81:559-575
20. Staiger D, Stock JH. Instrumental variables regression with weak instruments. Econometrica. 1997;65:557-586
21. Burgess S, Thompson SG. Avoiding bias from weak instruments in Mendelian randomization studies. Int J Epidemiol. 2011;40:755-764
22. Carter AR, Sanderson E, Hammerton G. et al. Mendelian randomisation for mediation analysis: current methods and challenges for implementation. Eur J Epidemiol. 2021;36:465-478
23. Burgess S. Sample size and power calculations in Mendelian randomization with a single instrumental variable and a binary outcome. Int J Epidemiol. 2014;43:922-929
24. Yoshihara K, Shahmoradgoli M, Martínez E. et al. Inferring tumour purity and stromal and immune cell admixture from expression data. Nat Commun. 2013;4:2612
25. Cox DR. Regression models and life-tables. J R Stat Soc Series B Stat Methodol. 1972;34:187-202
26. Stuart T, Butler A, Hoffman P. et al. Comprehensive integration of single-cell data. Cell. 2019;177:1888-1902.e21
27. Yang S, Corbett SE, Koga Y. et al. Decontamination of ambient RNA in single-cell RNA-seq with DecontX. Genome Biol. 2020;21:57
28. Zappia L, Oshlack A. Clustering trees: a visualization for evaluating clusterings at multiple resolutions. Gigascience. 2018;7:giy083
29. Mäkitie T, Summanen P, Tarkkanen A, Kivelä T. Tumor-infiltrating macrophages (CD68+ cells) and prognosis in malignant uveal melanoma. Invest Ophthalmol Vis Sci. 2001;42:1414-1421
30. Bronkhorst IH, Ly LV, Jordanova ES. et al. Detection of M2-macrophages in uveal melanoma and relation with survival. Invest Ophthalmol Vis Sci. 2011;52:643-650
Author contact
Corresponding author: Zhaoyang Wang, MD, Department of Ophthalmology, Beijing Tongren Eye Center, Beijing Tongren Hospital, Capital Medical University, No. 1 Dongjiaominxiang, Dongcheng District, Beijing 100730, China. Email: wangzhaoyangophthalmologyccmu.edu.cn.